Immigrants from Uganda vs Shoshone Married-Couple Family Poverty
COMPARE
Immigrants from Uganda
Shoshone
Married-Couple Family Poverty
Married-Couple Family Poverty Comparison
Immigrants from Uganda
Shoshone
5.2%
MARRIED-COUPLE FAMILY POVERTY
54.9/ 100
METRIC RATING
168th/ 347
METRIC RANK
6.1%
MARRIED-COUPLE FAMILY POVERTY
0.3/ 100
METRIC RATING
262nd/ 347
METRIC RANK
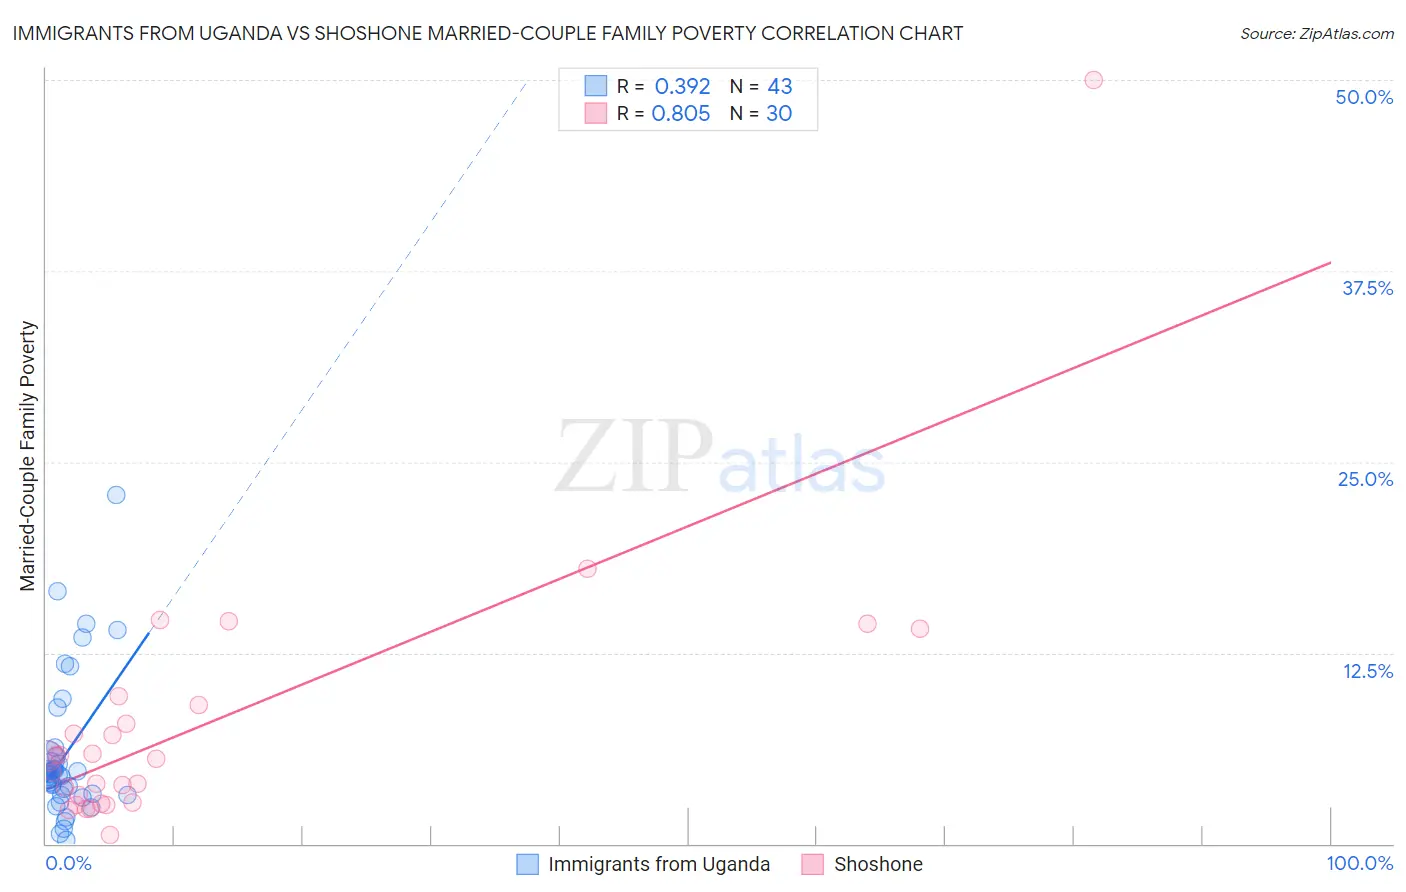
Immigrants from Uganda vs Shoshone Married-Couple Family Poverty Correlation Chart
The statistical analysis conducted on geographies consisting of 125,662,794 people shows a mild positive correlation between the proportion of Immigrants from Uganda and poverty level among married-couple families in the United States with a correlation coefficient (R) of 0.392 and weighted average of 5.2%. Similarly, the statistical analysis conducted on geographies consisting of 66,505,445 people shows a very strong positive correlation between the proportion of Shoshone and poverty level among married-couple families in the United States with a correlation coefficient (R) of 0.805 and weighted average of 6.1%, a difference of 17.6%.
Married-Couple Family Poverty Correlation Summary
| Measurement | Immigrants from Uganda | Shoshone |
| Minimum | 0.25% | 0.60% |
| Maximum | 22.9% | 50.0% |
| Range | 22.6% | 49.4% |
| Mean | 5.8% | 7.9% |
| Median | 4.5% | 5.6% |
| Interquartile 25% (IQ1) | 3.2% | 2.7% |
| Interquartile 75% (IQ3) | 5.7% | 9.1% |
| Interquartile Range (IQR) | 2.5% | 6.4% |
| Standard Deviation (Sample) | 4.7% | 9.2% |
| Standard Deviation (Population) | 4.6% | 9.0% |
Similar Demographics by Married-Couple Family Poverty
Demographics Similar to Immigrants from Uganda by Married-Couple Family Poverty
In terms of married-couple family poverty, the demographic groups most similar to Immigrants from Uganda are Ottawa (5.2%, a difference of 0.040%), Immigrants from Argentina (5.2%, a difference of 0.060%), Bermudan (5.2%, a difference of 0.23%), Immigrants from Northern Africa (5.2%, a difference of 0.41%), and Alsatian (5.2%, a difference of 0.43%).
| Demographics | Rating | Rank | Married-Couple Family Poverty |
| Ethiopians | 68.1 /100 | #161 | Good 5.1% |
| Immigrants | Jordan | 66.5 /100 | #162 | Good 5.1% |
| Sierra Leoneans | 64.1 /100 | #163 | Good 5.1% |
| Hawaiians | 62.3 /100 | #164 | Good 5.1% |
| Immigrants | Malaysia | 62.2 /100 | #165 | Good 5.1% |
| Paraguayans | 61.5 /100 | #166 | Good 5.1% |
| Costa Ricans | 61.5 /100 | #167 | Good 5.1% |
| Immigrants | Uganda | 54.9 /100 | #168 | Average 5.2% |
| Ottawa | 54.5 /100 | #169 | Average 5.2% |
| Immigrants | Argentina | 54.4 /100 | #170 | Average 5.2% |
| Bermudans | 52.9 /100 | #171 | Average 5.2% |
| Immigrants | Northern Africa | 51.3 /100 | #172 | Average 5.2% |
| Alsatians | 51.2 /100 | #173 | Average 5.2% |
| Immigrants | Eastern Africa | 50.0 /100 | #174 | Average 5.2% |
| Marshallese | 47.9 /100 | #175 | Average 5.2% |
Demographics Similar to Shoshone by Married-Couple Family Poverty
In terms of married-couple family poverty, the demographic groups most similar to Shoshone are Senegalese (6.1%, a difference of 0.21%), Immigrants from Senegal (6.1%, a difference of 0.39%), Jamaican (6.1%, a difference of 0.40%), Alaskan Athabascan (6.1%, a difference of 0.61%), and Immigrants from Congo (6.1%, a difference of 0.62%).
| Demographics | Rating | Rank | Married-Couple Family Poverty |
| Comanche | 0.7 /100 | #255 | Tragic 6.0% |
| Bangladeshis | 0.5 /100 | #256 | Tragic 6.0% |
| Immigrants | Burma/Myanmar | 0.5 /100 | #257 | Tragic 6.0% |
| Immigrants | Immigrants | 0.5 /100 | #258 | Tragic 6.0% |
| Alaskan Athabascans | 0.4 /100 | #259 | Tragic 6.1% |
| Jamaicans | 0.3 /100 | #260 | Tragic 6.1% |
| Senegalese | 0.3 /100 | #261 | Tragic 6.1% |
| Shoshone | 0.3 /100 | #262 | Tragic 6.1% |
| Immigrants | Senegal | 0.3 /100 | #263 | Tragic 6.1% |
| Immigrants | Congo | 0.2 /100 | #264 | Tragic 6.1% |
| Blackfeet | 0.2 /100 | #265 | Tragic 6.2% |
| Creek | 0.2 /100 | #266 | Tragic 6.2% |
| Spanish Americans | 0.2 /100 | #267 | Tragic 6.2% |
| Alaska Natives | 0.2 /100 | #268 | Tragic 6.2% |
| Immigrants | West Indies | 0.1 /100 | #269 | Tragic 6.2% |