Immigrants from Turkey vs Guyanese Male Poverty
COMPARE
Immigrants from Turkey
Guyanese
Male Poverty
Male Poverty Comparison
Immigrants from Turkey
Guyanese
10.6%
MALE POVERTY
89.5/ 100
METRIC RATING
112th/ 347
METRIC RANK
13.3%
MALE POVERTY
0.0/ 100
METRIC RATING
269th/ 347
METRIC RANK
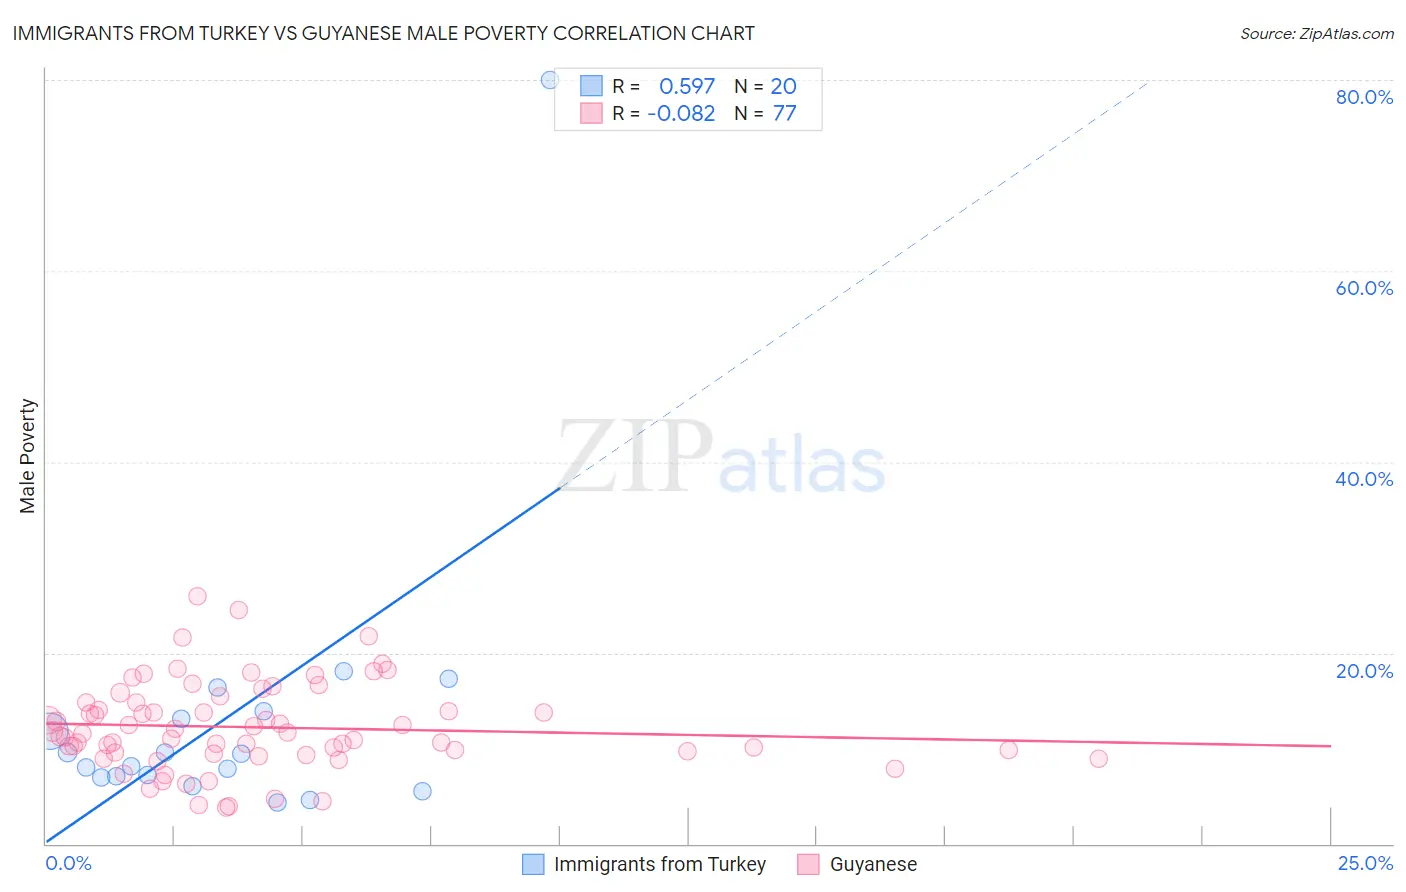
Immigrants from Turkey vs Guyanese Male Poverty Correlation Chart
The statistical analysis conducted on geographies consisting of 222,940,059 people shows a substantial positive correlation between the proportion of Immigrants from Turkey and poverty level among males in the United States with a correlation coefficient (R) of 0.597 and weighted average of 10.6%. Similarly, the statistical analysis conducted on geographies consisting of 176,774,769 people shows a slight negative correlation between the proportion of Guyanese and poverty level among males in the United States with a correlation coefficient (R) of -0.082 and weighted average of 13.3%, a difference of 25.3%.
Male Poverty Correlation Summary
| Measurement | Immigrants from Turkey | Guyanese |
| Minimum | 4.4% | 3.8% |
| Maximum | 80.0% | 25.9% |
| Range | 75.6% | 22.1% |
| Mean | 13.2% | 12.2% |
| Median | 8.7% | 11.5% |
| Interquartile 25% (IQ1) | 7.0% | 9.5% |
| Interquartile 75% (IQ3) | 13.5% | 14.8% |
| Interquartile Range (IQR) | 6.4% | 5.3% |
| Standard Deviation (Sample) | 16.2% | 4.6% |
| Standard Deviation (Population) | 15.8% | 4.6% |
Similar Demographics by Male Poverty
Demographics Similar to Immigrants from Turkey by Male Poverty
In terms of male poverty, the demographic groups most similar to Immigrants from Turkey are Immigrants from Argentina (10.6%, a difference of 0.080%), Palestinian (10.6%, a difference of 0.10%), Immigrants from Brazil (10.6%, a difference of 0.12%), Argentinean (10.6%, a difference of 0.19%), and Immigrants from Russia (10.6%, a difference of 0.24%).
| Demographics | Rating | Rank | Male Poverty |
| Canadians | 91.6 /100 | #105 | Exceptional 10.5% |
| Immigrants | Southern Europe | 91.3 /100 | #106 | Exceptional 10.5% |
| Laotians | 91.2 /100 | #107 | Exceptional 10.5% |
| Portuguese | 91.0 /100 | #108 | Exceptional 10.6% |
| Albanians | 90.6 /100 | #109 | Exceptional 10.6% |
| Argentineans | 90.1 /100 | #110 | Exceptional 10.6% |
| Immigrants | Argentina | 89.8 /100 | #111 | Excellent 10.6% |
| Immigrants | Turkey | 89.5 /100 | #112 | Excellent 10.6% |
| Palestinians | 89.1 /100 | #113 | Excellent 10.6% |
| Immigrants | Brazil | 89.0 /100 | #114 | Excellent 10.6% |
| Immigrants | Russia | 88.6 /100 | #115 | Excellent 10.6% |
| Sri Lankans | 88.1 /100 | #116 | Excellent 10.6% |
| Immigrants | South Eastern Asia | 88.1 /100 | #117 | Excellent 10.6% |
| Okinawans | 87.6 /100 | #118 | Excellent 10.7% |
| Immigrants | Hungary | 87.6 /100 | #119 | Excellent 10.7% |
Demographics Similar to Guyanese by Male Poverty
In terms of male poverty, the demographic groups most similar to Guyanese are Subsaharan African (13.3%, a difference of 0.22%), Immigrants from Jamaica (13.3%, a difference of 0.25%), Immigrants from Guyana (13.2%, a difference of 0.36%), Cree (13.3%, a difference of 0.47%), and Spanish American (13.4%, a difference of 0.50%).
| Demographics | Rating | Rank | Male Poverty |
| Spanish American Indians | 0.1 /100 | #262 | Tragic 13.1% |
| Central Americans | 0.1 /100 | #263 | Tragic 13.2% |
| Iroquois | 0.1 /100 | #264 | Tragic 13.2% |
| Jamaicans | 0.1 /100 | #265 | Tragic 13.2% |
| Immigrants | Guyana | 0.1 /100 | #266 | Tragic 13.2% |
| Immigrants | Jamaica | 0.1 /100 | #267 | Tragic 13.3% |
| Sub-Saharan Africans | 0.1 /100 | #268 | Tragic 13.3% |
| Guyanese | 0.0 /100 | #269 | Tragic 13.3% |
| Cree | 0.0 /100 | #270 | Tragic 13.3% |
| Spanish Americans | 0.0 /100 | #271 | Tragic 13.4% |
| Immigrants | Bahamas | 0.0 /100 | #272 | Tragic 13.5% |
| Chickasaw | 0.0 /100 | #273 | Tragic 13.5% |
| Immigrants | West Indies | 0.0 /100 | #274 | Tragic 13.5% |
| Barbadians | 0.0 /100 | #275 | Tragic 13.6% |
| Immigrants | Latin America | 0.0 /100 | #276 | Tragic 13.6% |