Arapaho vs Guyanese Male Poverty
COMPARE
Arapaho
Guyanese
Male Poverty
Male Poverty Comparison
Arapaho
Guyanese
15.1%
MALE POVERTY
0.0/ 100
METRIC RATING
321st/ 347
METRIC RANK
13.3%
MALE POVERTY
0.0/ 100
METRIC RATING
269th/ 347
METRIC RANK
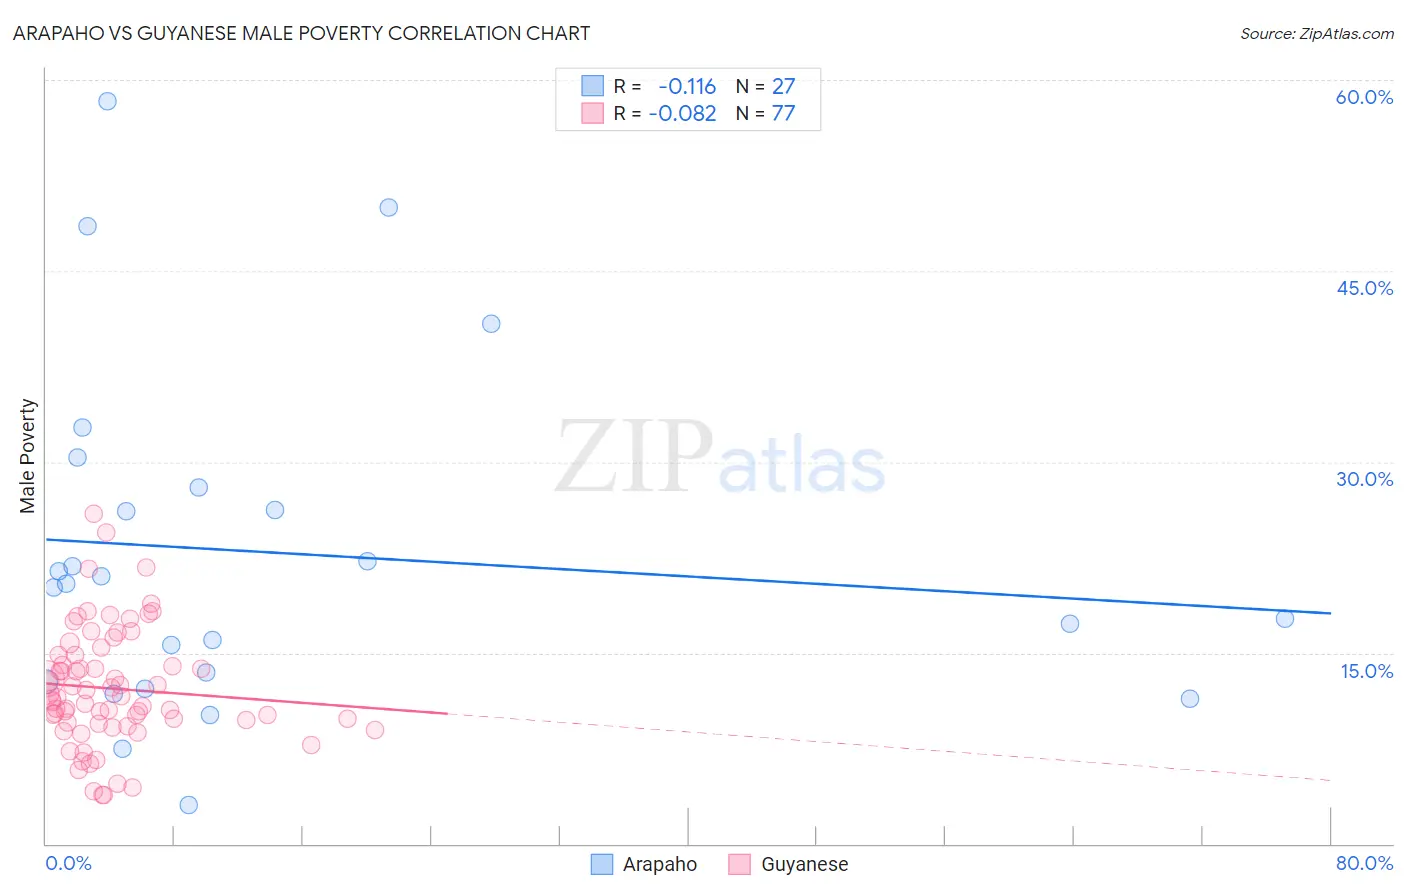
Arapaho vs Guyanese Male Poverty Correlation Chart
The statistical analysis conducted on geographies consisting of 29,777,916 people shows a poor negative correlation between the proportion of Arapaho and poverty level among males in the United States with a correlation coefficient (R) of -0.116 and weighted average of 15.1%. Similarly, the statistical analysis conducted on geographies consisting of 176,774,769 people shows a slight negative correlation between the proportion of Guyanese and poverty level among males in the United States with a correlation coefficient (R) of -0.082 and weighted average of 13.3%, a difference of 13.5%.
Male Poverty Correlation Summary
| Measurement | Arapaho | Guyanese |
| Minimum | 3.0% | 3.8% |
| Maximum | 58.3% | 25.9% |
| Range | 55.3% | 22.1% |
| Mean | 22.8% | 12.2% |
| Median | 20.4% | 11.5% |
| Interquartile 25% (IQ1) | 12.7% | 9.5% |
| Interquartile 75% (IQ3) | 28.0% | 14.8% |
| Interquartile Range (IQR) | 15.3% | 5.3% |
| Standard Deviation (Sample) | 13.5% | 4.6% |
| Standard Deviation (Population) | 13.2% | 4.6% |
Similar Demographics by Male Poverty
Demographics Similar to Arapaho by Male Poverty
In terms of male poverty, the demographic groups most similar to Arapaho are Kiowa (15.2%, a difference of 0.72%), Colville (15.2%, a difference of 1.1%), Menominee (15.3%, a difference of 1.3%), Yakama (15.3%, a difference of 1.5%), and Central American Indian (15.3%, a difference of 1.6%).
| Demographics | Rating | Rank | Male Poverty |
| Immigrants | Honduras | 0.0 /100 | #314 | Tragic 14.6% |
| Chippewa | 0.0 /100 | #315 | Tragic 14.6% |
| British West Indians | 0.0 /100 | #316 | Tragic 14.6% |
| Immigrants | Dominica | 0.0 /100 | #317 | Tragic 14.7% |
| Immigrants | Grenada | 0.0 /100 | #318 | Tragic 14.7% |
| U.S. Virgin Islanders | 0.0 /100 | #319 | Tragic 14.7% |
| Immigrants | Congo | 0.0 /100 | #320 | Tragic 14.7% |
| Arapaho | 0.0 /100 | #321 | Tragic 15.1% |
| Kiowa | 0.0 /100 | #322 | Tragic 15.2% |
| Colville | 0.0 /100 | #323 | Tragic 15.2% |
| Menominee | 0.0 /100 | #324 | Tragic 15.3% |
| Yakama | 0.0 /100 | #325 | Tragic 15.3% |
| Central American Indians | 0.0 /100 | #326 | Tragic 15.3% |
| Paiute | 0.0 /100 | #327 | Tragic 15.8% |
| Blacks/African Americans | 0.0 /100 | #328 | Tragic 15.8% |
Demographics Similar to Guyanese by Male Poverty
In terms of male poverty, the demographic groups most similar to Guyanese are Subsaharan African (13.3%, a difference of 0.22%), Immigrants from Jamaica (13.3%, a difference of 0.25%), Immigrants from Guyana (13.2%, a difference of 0.36%), Cree (13.3%, a difference of 0.47%), and Spanish American (13.4%, a difference of 0.50%).
| Demographics | Rating | Rank | Male Poverty |
| Spanish American Indians | 0.1 /100 | #262 | Tragic 13.1% |
| Central Americans | 0.1 /100 | #263 | Tragic 13.2% |
| Iroquois | 0.1 /100 | #264 | Tragic 13.2% |
| Jamaicans | 0.1 /100 | #265 | Tragic 13.2% |
| Immigrants | Guyana | 0.1 /100 | #266 | Tragic 13.2% |
| Immigrants | Jamaica | 0.1 /100 | #267 | Tragic 13.3% |
| Sub-Saharan Africans | 0.1 /100 | #268 | Tragic 13.3% |
| Guyanese | 0.0 /100 | #269 | Tragic 13.3% |
| Cree | 0.0 /100 | #270 | Tragic 13.3% |
| Spanish Americans | 0.0 /100 | #271 | Tragic 13.4% |
| Immigrants | Bahamas | 0.0 /100 | #272 | Tragic 13.5% |
| Chickasaw | 0.0 /100 | #273 | Tragic 13.5% |
| Immigrants | West Indies | 0.0 /100 | #274 | Tragic 13.5% |
| Barbadians | 0.0 /100 | #275 | Tragic 13.6% |
| Immigrants | Latin America | 0.0 /100 | #276 | Tragic 13.6% |