Costa Rican vs Guyanese Male Poverty
COMPARE
Costa Rican
Guyanese
Male Poverty
Male Poverty Comparison
Costa Ricans
Guyanese
11.0%
MALE POVERTY
63.9/ 100
METRIC RATING
156th/ 347
METRIC RANK
13.3%
MALE POVERTY
0.0/ 100
METRIC RATING
269th/ 347
METRIC RANK
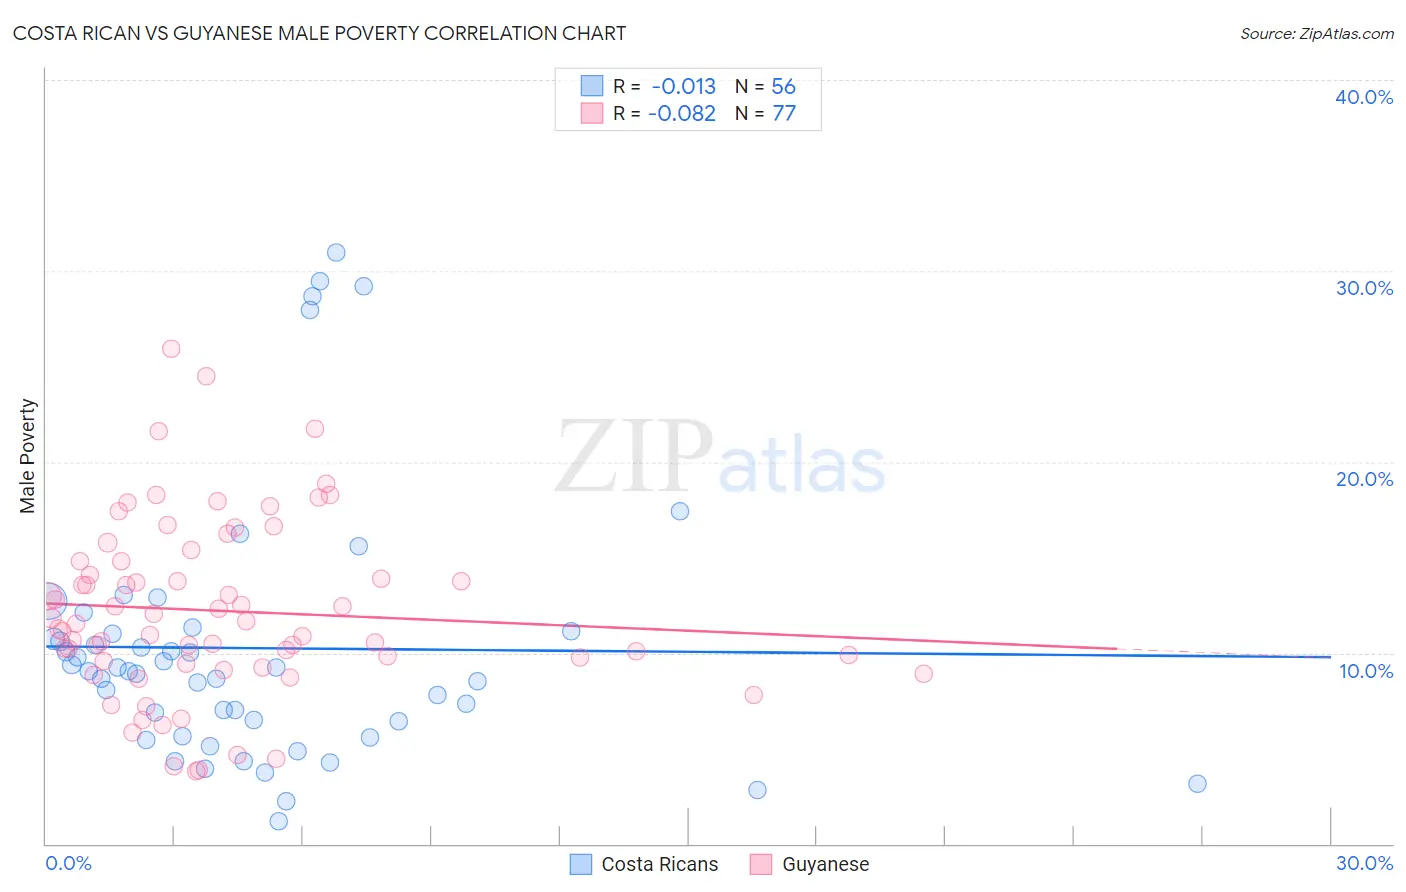
Costa Rican vs Guyanese Male Poverty Correlation Chart
The statistical analysis conducted on geographies consisting of 253,451,633 people shows no correlation between the proportion of Costa Ricans and poverty level among males in the United States with a correlation coefficient (R) of -0.013 and weighted average of 11.0%. Similarly, the statistical analysis conducted on geographies consisting of 176,774,769 people shows a slight negative correlation between the proportion of Guyanese and poverty level among males in the United States with a correlation coefficient (R) of -0.082 and weighted average of 13.3%, a difference of 20.4%.
Male Poverty Correlation Summary
| Measurement | Costa Rican | Guyanese |
| Minimum | 1.1% | 3.8% |
| Maximum | 31.0% | 25.9% |
| Range | 29.8% | 22.1% |
| Mean | 10.2% | 12.2% |
| Median | 9.0% | 11.5% |
| Interquartile 25% (IQ1) | 6.0% | 9.5% |
| Interquartile 75% (IQ3) | 11.0% | 14.8% |
| Interquartile Range (IQR) | 5.0% | 5.3% |
| Standard Deviation (Sample) | 6.9% | 4.6% |
| Standard Deviation (Population) | 6.8% | 4.6% |
Similar Demographics by Male Poverty
Demographics Similar to Costa Ricans by Male Poverty
In terms of male poverty, the demographic groups most similar to Costa Ricans are Scotch-Irish (11.0%, a difference of 0.020%), Immigrants from Malaysia (11.0%, a difference of 0.090%), Immigrants from Kazakhstan (11.0%, a difference of 0.10%), Colombian (11.0%, a difference of 0.10%), and Taiwanese (11.0%, a difference of 0.12%).
| Demographics | Rating | Rank | Male Poverty |
| Immigrants | Venezuela | 67.9 /100 | #149 | Good 11.0% |
| Guamanians/Chamorros | 67.6 /100 | #150 | Good 11.0% |
| Venezuelans | 67.4 /100 | #151 | Good 11.0% |
| Immigrants | Nepal | 67.3 /100 | #152 | Good 11.0% |
| Immigrants | Bosnia and Herzegovina | 65.2 /100 | #153 | Good 11.0% |
| Immigrants | Kazakhstan | 64.8 /100 | #154 | Good 11.0% |
| Immigrants | Malaysia | 64.7 /100 | #155 | Good 11.0% |
| Costa Ricans | 63.9 /100 | #156 | Good 11.0% |
| Scotch-Irish | 63.7 /100 | #157 | Good 11.0% |
| Colombians | 63.0 /100 | #158 | Good 11.0% |
| Taiwanese | 62.7 /100 | #159 | Good 11.0% |
| Soviet Union | 60.3 /100 | #160 | Good 11.1% |
| Immigrants | Northern Africa | 59.7 /100 | #161 | Average 11.1% |
| Immigrants | Chile | 57.4 /100 | #162 | Average 11.1% |
| Whites/Caucasians | 56.7 /100 | #163 | Average 11.1% |
Demographics Similar to Guyanese by Male Poverty
In terms of male poverty, the demographic groups most similar to Guyanese are Subsaharan African (13.3%, a difference of 0.22%), Immigrants from Jamaica (13.3%, a difference of 0.25%), Immigrants from Guyana (13.2%, a difference of 0.36%), Cree (13.3%, a difference of 0.47%), and Spanish American (13.4%, a difference of 0.50%).
| Demographics | Rating | Rank | Male Poverty |
| Spanish American Indians | 0.1 /100 | #262 | Tragic 13.1% |
| Central Americans | 0.1 /100 | #263 | Tragic 13.2% |
| Iroquois | 0.1 /100 | #264 | Tragic 13.2% |
| Jamaicans | 0.1 /100 | #265 | Tragic 13.2% |
| Immigrants | Guyana | 0.1 /100 | #266 | Tragic 13.2% |
| Immigrants | Jamaica | 0.1 /100 | #267 | Tragic 13.3% |
| Sub-Saharan Africans | 0.1 /100 | #268 | Tragic 13.3% |
| Guyanese | 0.0 /100 | #269 | Tragic 13.3% |
| Cree | 0.0 /100 | #270 | Tragic 13.3% |
| Spanish Americans | 0.0 /100 | #271 | Tragic 13.4% |
| Immigrants | Bahamas | 0.0 /100 | #272 | Tragic 13.5% |
| Chickasaw | 0.0 /100 | #273 | Tragic 13.5% |
| Immigrants | West Indies | 0.0 /100 | #274 | Tragic 13.5% |
| Barbadians | 0.0 /100 | #275 | Tragic 13.6% |
| Immigrants | Latin America | 0.0 /100 | #276 | Tragic 13.6% |