Immigrants from Cameroon vs Guyanese Male Poverty
COMPARE
Immigrants from Cameroon
Guyanese
Male Poverty
Male Poverty Comparison
Immigrants from Cameroon
Guyanese
11.2%
MALE POVERTY
44.5/ 100
METRIC RATING
178th/ 347
METRIC RANK
13.3%
MALE POVERTY
0.0/ 100
METRIC RATING
269th/ 347
METRIC RANK
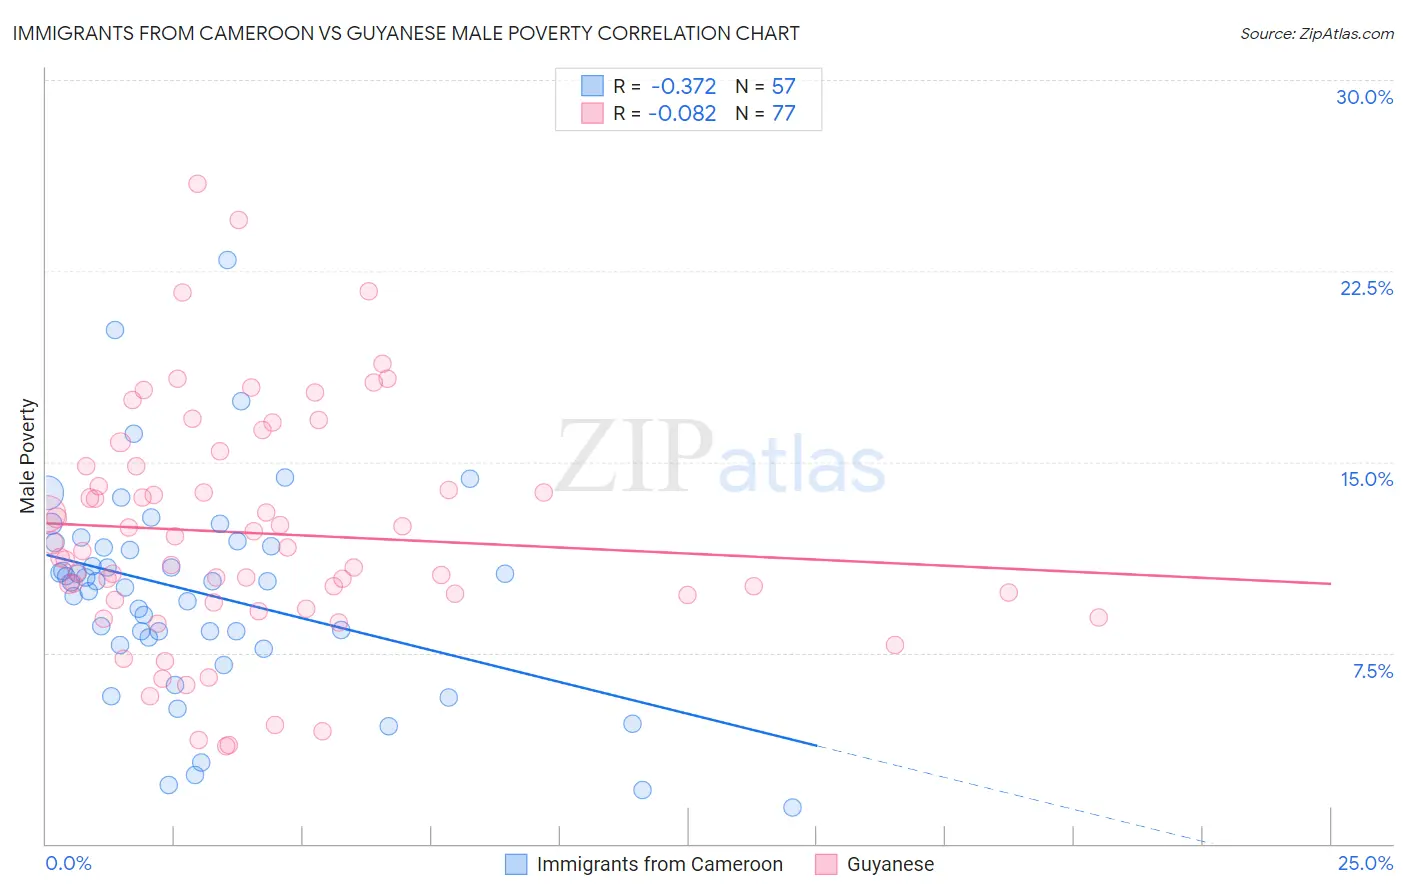
Immigrants from Cameroon vs Guyanese Male Poverty Correlation Chart
The statistical analysis conducted on geographies consisting of 130,706,332 people shows a mild negative correlation between the proportion of Immigrants from Cameroon and poverty level among males in the United States with a correlation coefficient (R) of -0.372 and weighted average of 11.2%. Similarly, the statistical analysis conducted on geographies consisting of 176,774,769 people shows a slight negative correlation between the proportion of Guyanese and poverty level among males in the United States with a correlation coefficient (R) of -0.082 and weighted average of 13.3%, a difference of 18.1%.
Male Poverty Correlation Summary
| Measurement | Immigrants from Cameroon | Guyanese |
| Minimum | 1.4% | 3.8% |
| Maximum | 22.9% | 25.9% |
| Range | 21.5% | 22.1% |
| Mean | 9.8% | 12.2% |
| Median | 10.3% | 11.5% |
| Interquartile 25% (IQ1) | 8.0% | 9.5% |
| Interquartile 75% (IQ3) | 11.7% | 14.8% |
| Interquartile Range (IQR) | 3.8% | 5.3% |
| Standard Deviation (Sample) | 4.1% | 4.6% |
| Standard Deviation (Population) | 4.1% | 4.6% |
Similar Demographics by Male Poverty
Demographics Similar to Immigrants from Cameroon by Male Poverty
In terms of male poverty, the demographic groups most similar to Immigrants from Cameroon are Lebanese (11.2%, a difference of 0.11%), Immigrants from Fiji (11.2%, a difference of 0.15%), Celtic (11.2%, a difference of 0.29%), Immigrants from Syria (11.3%, a difference of 0.43%), and Immigrants from Morocco (11.3%, a difference of 0.44%).
| Demographics | Rating | Rank | Male Poverty |
| Uruguayans | 51.0 /100 | #171 | Average 11.2% |
| Immigrants | Ethiopia | 50.7 /100 | #172 | Average 11.2% |
| Pennsylvania Germans | 50.5 /100 | #173 | Average 11.2% |
| Immigrants | Oceania | 50.0 /100 | #174 | Average 11.2% |
| Celtics | 47.5 /100 | #175 | Average 11.2% |
| Immigrants | Fiji | 46.0 /100 | #176 | Average 11.2% |
| Lebanese | 45.6 /100 | #177 | Average 11.2% |
| Immigrants | Cameroon | 44.5 /100 | #178 | Average 11.2% |
| Immigrants | Syria | 40.3 /100 | #179 | Average 11.3% |
| Immigrants | Morocco | 40.1 /100 | #180 | Average 11.3% |
| Immigrants | Costa Rica | 39.5 /100 | #181 | Fair 11.3% |
| Mongolians | 39.0 /100 | #182 | Fair 11.3% |
| Kenyans | 38.4 /100 | #183 | Fair 11.3% |
| Immigrants | South America | 36.9 /100 | #184 | Fair 11.3% |
| Immigrants | Afghanistan | 33.3 /100 | #185 | Fair 11.4% |
Demographics Similar to Guyanese by Male Poverty
In terms of male poverty, the demographic groups most similar to Guyanese are Subsaharan African (13.3%, a difference of 0.22%), Immigrants from Jamaica (13.3%, a difference of 0.25%), Immigrants from Guyana (13.2%, a difference of 0.36%), Cree (13.3%, a difference of 0.47%), and Spanish American (13.4%, a difference of 0.50%).
| Demographics | Rating | Rank | Male Poverty |
| Spanish American Indians | 0.1 /100 | #262 | Tragic 13.1% |
| Central Americans | 0.1 /100 | #263 | Tragic 13.2% |
| Iroquois | 0.1 /100 | #264 | Tragic 13.2% |
| Jamaicans | 0.1 /100 | #265 | Tragic 13.2% |
| Immigrants | Guyana | 0.1 /100 | #266 | Tragic 13.2% |
| Immigrants | Jamaica | 0.1 /100 | #267 | Tragic 13.3% |
| Sub-Saharan Africans | 0.1 /100 | #268 | Tragic 13.3% |
| Guyanese | 0.0 /100 | #269 | Tragic 13.3% |
| Cree | 0.0 /100 | #270 | Tragic 13.3% |
| Spanish Americans | 0.0 /100 | #271 | Tragic 13.4% |
| Immigrants | Bahamas | 0.0 /100 | #272 | Tragic 13.5% |
| Chickasaw | 0.0 /100 | #273 | Tragic 13.5% |
| Immigrants | West Indies | 0.0 /100 | #274 | Tragic 13.5% |
| Barbadians | 0.0 /100 | #275 | Tragic 13.6% |
| Immigrants | Latin America | 0.0 /100 | #276 | Tragic 13.6% |