Delaware vs Guyanese Male Poverty
COMPARE
Delaware
Guyanese
Male Poverty
Male Poverty Comparison
Delaware
Guyanese
11.7%
MALE POVERTY
15.4/ 100
METRIC RATING
197th/ 347
METRIC RANK
13.3%
MALE POVERTY
0.0/ 100
METRIC RATING
269th/ 347
METRIC RANK
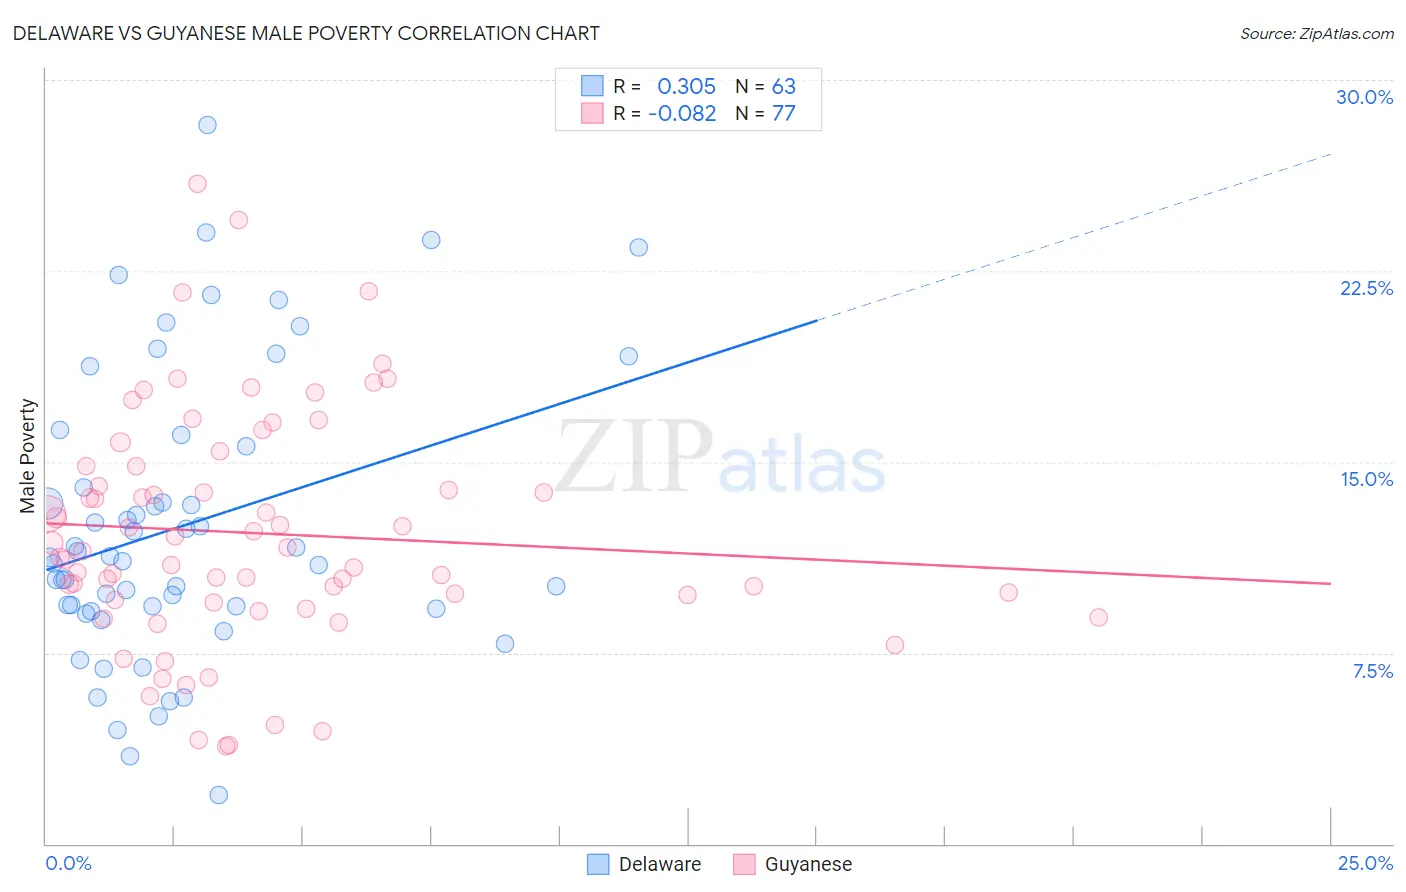
Delaware vs Guyanese Male Poverty Correlation Chart
The statistical analysis conducted on geographies consisting of 96,214,887 people shows a mild positive correlation between the proportion of Delaware and poverty level among males in the United States with a correlation coefficient (R) of 0.305 and weighted average of 11.7%. Similarly, the statistical analysis conducted on geographies consisting of 176,774,769 people shows a slight negative correlation between the proportion of Guyanese and poverty level among males in the United States with a correlation coefficient (R) of -0.082 and weighted average of 13.3%, a difference of 14.0%.
Male Poverty Correlation Summary
| Measurement | Delaware | Guyanese |
| Minimum | 1.9% | 3.8% |
| Maximum | 28.2% | 25.9% |
| Range | 26.3% | 22.1% |
| Mean | 12.5% | 12.2% |
| Median | 11.2% | 11.5% |
| Interquartile 25% (IQ1) | 9.2% | 9.5% |
| Interquartile 75% (IQ3) | 15.6% | 14.8% |
| Interquartile Range (IQR) | 6.4% | 5.3% |
| Standard Deviation (Sample) | 5.6% | 4.6% |
| Standard Deviation (Population) | 5.6% | 4.6% |
Similar Demographics by Male Poverty
Demographics Similar to Delaware by Male Poverty
In terms of male poverty, the demographic groups most similar to Delaware are Hmong (11.6%, a difference of 0.060%), Arab (11.6%, a difference of 0.070%), Immigrants from Kenya (11.6%, a difference of 0.12%), Iraqi (11.7%, a difference of 0.14%), and Spanish (11.7%, a difference of 0.24%).
| Demographics | Rating | Rank | Male Poverty |
| Israelis | 26.1 /100 | #190 | Fair 11.5% |
| South American Indians | 22.8 /100 | #191 | Fair 11.5% |
| Immigrants | Uruguay | 19.1 /100 | #192 | Poor 11.6% |
| Immigrants | Kuwait | 17.3 /100 | #193 | Poor 11.6% |
| Immigrants | Kenya | 16.1 /100 | #194 | Poor 11.6% |
| Arabs | 15.8 /100 | #195 | Poor 11.6% |
| Hmong | 15.8 /100 | #196 | Poor 11.6% |
| Delaware | 15.4 /100 | #197 | Poor 11.7% |
| Iraqis | 14.7 /100 | #198 | Poor 11.7% |
| Spanish | 14.1 /100 | #199 | Poor 11.7% |
| Immigrants | Lebanon | 13.6 /100 | #200 | Poor 11.7% |
| Spaniards | 13.5 /100 | #201 | Poor 11.7% |
| Aleuts | 10.4 /100 | #202 | Poor 11.8% |
| Immigrants | Western Asia | 9.8 /100 | #203 | Tragic 11.8% |
| Immigrants | Uganda | 8.5 /100 | #204 | Tragic 11.8% |
Demographics Similar to Guyanese by Male Poverty
In terms of male poverty, the demographic groups most similar to Guyanese are Subsaharan African (13.3%, a difference of 0.22%), Immigrants from Jamaica (13.3%, a difference of 0.25%), Immigrants from Guyana (13.2%, a difference of 0.36%), Cree (13.3%, a difference of 0.47%), and Spanish American (13.4%, a difference of 0.50%).
| Demographics | Rating | Rank | Male Poverty |
| Spanish American Indians | 0.1 /100 | #262 | Tragic 13.1% |
| Central Americans | 0.1 /100 | #263 | Tragic 13.2% |
| Iroquois | 0.1 /100 | #264 | Tragic 13.2% |
| Jamaicans | 0.1 /100 | #265 | Tragic 13.2% |
| Immigrants | Guyana | 0.1 /100 | #266 | Tragic 13.2% |
| Immigrants | Jamaica | 0.1 /100 | #267 | Tragic 13.3% |
| Sub-Saharan Africans | 0.1 /100 | #268 | Tragic 13.3% |
| Guyanese | 0.0 /100 | #269 | Tragic 13.3% |
| Cree | 0.0 /100 | #270 | Tragic 13.3% |
| Spanish Americans | 0.0 /100 | #271 | Tragic 13.4% |
| Immigrants | Bahamas | 0.0 /100 | #272 | Tragic 13.5% |
| Chickasaw | 0.0 /100 | #273 | Tragic 13.5% |
| Immigrants | West Indies | 0.0 /100 | #274 | Tragic 13.5% |
| Barbadians | 0.0 /100 | #275 | Tragic 13.6% |
| Immigrants | Latin America | 0.0 /100 | #276 | Tragic 13.6% |