Immigrants from Turkey vs Guyanese Cognitive Disability
COMPARE
Immigrants from Turkey
Guyanese
Cognitive Disability
Cognitive Disability Comparison
Immigrants from Turkey
Guyanese
17.2%
COGNITIVE DISABILITY
56.7/ 100
METRIC RATING
172nd/ 347
METRIC RANK
17.5%
COGNITIVE DISABILITY
17.5/ 100
METRIC RATING
196th/ 347
METRIC RANK
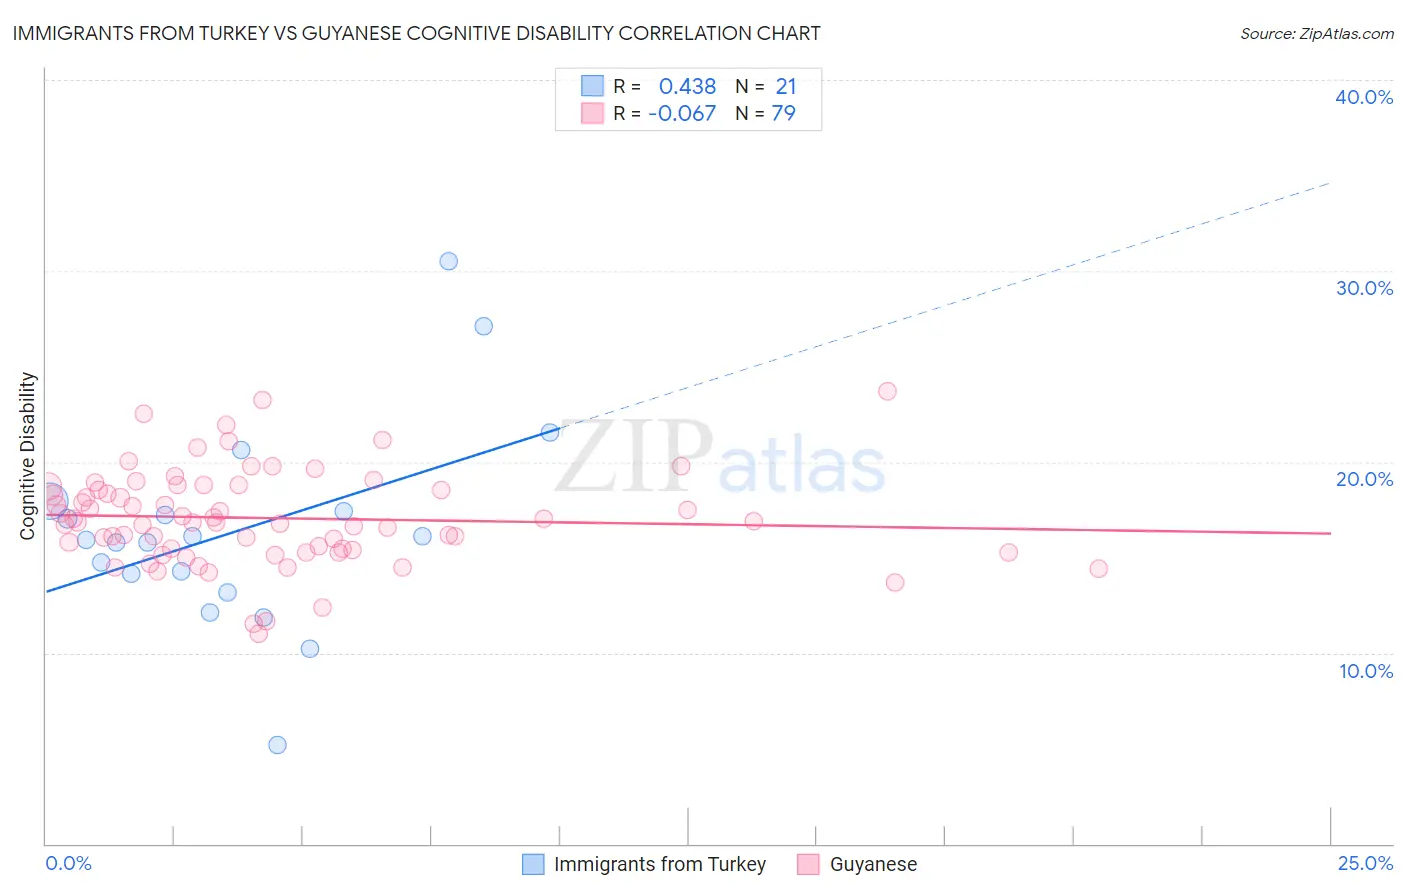
Immigrants from Turkey vs Guyanese Cognitive Disability Correlation Chart
The statistical analysis conducted on geographies consisting of 223,051,603 people shows a moderate positive correlation between the proportion of Immigrants from Turkey and percentage of population with cognitive disability in the United States with a correlation coefficient (R) of 0.438 and weighted average of 17.2%. Similarly, the statistical analysis conducted on geographies consisting of 176,911,686 people shows a slight negative correlation between the proportion of Guyanese and percentage of population with cognitive disability in the United States with a correlation coefficient (R) of -0.067 and weighted average of 17.5%, a difference of 1.3%.
Cognitive Disability Correlation Summary
| Measurement | Immigrants from Turkey | Guyanese |
| Minimum | 5.2% | 11.0% |
| Maximum | 30.5% | 23.7% |
| Range | 25.3% | 12.7% |
| Mean | 16.4% | 17.1% |
| Median | 15.9% | 16.9% |
| Interquartile 25% (IQ1) | 13.7% | 15.4% |
| Interquartile 75% (IQ3) | 17.7% | 18.7% |
| Interquartile Range (IQR) | 4.0% | 3.3% |
| Standard Deviation (Sample) | 5.4% | 2.5% |
| Standard Deviation (Population) | 5.3% | 2.5% |
Similar Demographics by Cognitive Disability
Demographics Similar to Immigrants from Turkey by Cognitive Disability
In terms of cognitive disability, the demographic groups most similar to Immigrants from Turkey are Tlingit-Haida (17.2%, a difference of 0.080%), Ecuadorian (17.2%, a difference of 0.090%), Immigrants from Portugal (17.2%, a difference of 0.15%), Immigrants (17.2%, a difference of 0.17%), and Immigrants from Northern Africa (17.3%, a difference of 0.18%).
| Demographics | Rating | Rank | Cognitive Disability |
| Immigrants | Albania | 64.9 /100 | #165 | Good 17.2% |
| Immigrants | Ecuador | 64.4 /100 | #166 | Good 17.2% |
| Immigrants | Syria | 63.5 /100 | #167 | Good 17.2% |
| Immigrants | Immigrants | 62.5 /100 | #168 | Good 17.2% |
| Immigrants | Portugal | 61.8 /100 | #169 | Good 17.2% |
| Ecuadorians | 59.6 /100 | #170 | Average 17.2% |
| Tlingit-Haida | 59.4 /100 | #171 | Average 17.2% |
| Immigrants | Turkey | 56.7 /100 | #172 | Average 17.2% |
| Immigrants | Northern Africa | 50.2 /100 | #173 | Average 17.3% |
| Laotians | 50.0 /100 | #174 | Average 17.3% |
| Tsimshian | 49.8 /100 | #175 | Average 17.3% |
| Shoshone | 49.2 /100 | #176 | Average 17.3% |
| Ute | 49.1 /100 | #177 | Average 17.3% |
| Spanish | 48.9 /100 | #178 | Average 17.3% |
| Sioux | 48.6 /100 | #179 | Average 17.3% |
Demographics Similar to Guyanese by Cognitive Disability
In terms of cognitive disability, the demographic groups most similar to Guyanese are Immigrants from Afghanistan (17.5%, a difference of 0.040%), Immigrants from Panama (17.5%, a difference of 0.14%), New Zealander (17.4%, a difference of 0.16%), Immigrants from Singapore (17.5%, a difference of 0.17%), and Haitian (17.5%, a difference of 0.18%).
| Demographics | Rating | Rank | Cognitive Disability |
| Immigrants | Western Asia | 29.5 /100 | #189 | Fair 17.4% |
| Immigrants | Spain | 27.7 /100 | #190 | Fair 17.4% |
| Immigrants | Nonimmigrants | 27.4 /100 | #191 | Fair 17.4% |
| Immigrants | Haiti | 27.1 /100 | #192 | Fair 17.4% |
| Delaware | 25.6 /100 | #193 | Fair 17.4% |
| Immigrants | Bosnia and Herzegovina | 22.0 /100 | #194 | Fair 17.4% |
| New Zealanders | 21.1 /100 | #195 | Fair 17.4% |
| Guyanese | 17.5 /100 | #196 | Poor 17.5% |
| Immigrants | Afghanistan | 16.7 /100 | #197 | Poor 17.5% |
| Immigrants | Panama | 14.8 /100 | #198 | Poor 17.5% |
| Immigrants | Singapore | 14.3 /100 | #199 | Poor 17.5% |
| Haitians | 14.1 /100 | #200 | Poor 17.5% |
| South American Indians | 13.0 /100 | #201 | Poor 17.5% |
| Immigrants | Morocco | 12.0 /100 | #202 | Poor 17.5% |
| Immigrants | Caribbean | 11.0 /100 | #203 | Poor 17.5% |