Malaysian vs Guyanese Male Poverty
COMPARE
Malaysian
Guyanese
Male Poverty
Male Poverty Comparison
Malaysians
Guyanese
12.0%
MALE POVERTY
5.2/ 100
METRIC RATING
207th/ 347
METRIC RANK
13.3%
MALE POVERTY
0.0/ 100
METRIC RATING
269th/ 347
METRIC RANK
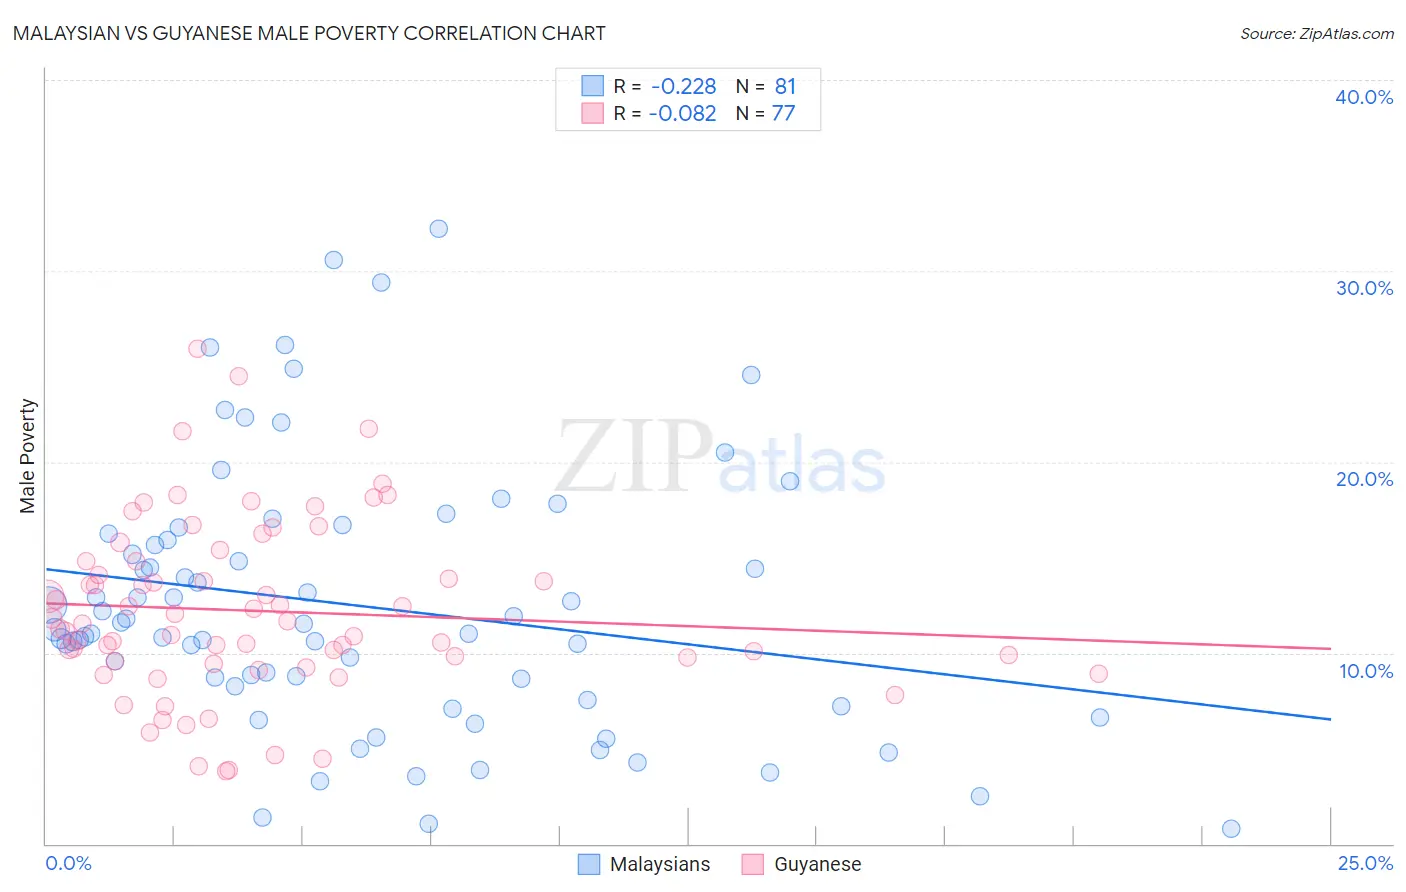
Malaysian vs Guyanese Male Poverty Correlation Chart
The statistical analysis conducted on geographies consisting of 225,986,127 people shows a weak negative correlation between the proportion of Malaysians and poverty level among males in the United States with a correlation coefficient (R) of -0.228 and weighted average of 12.0%. Similarly, the statistical analysis conducted on geographies consisting of 176,774,769 people shows a slight negative correlation between the proportion of Guyanese and poverty level among males in the United States with a correlation coefficient (R) of -0.082 and weighted average of 13.3%, a difference of 10.8%.
Male Poverty Correlation Summary
| Measurement | Malaysian | Guyanese |
| Minimum | 0.78% | 3.8% |
| Maximum | 32.2% | 25.9% |
| Range | 31.4% | 22.1% |
| Mean | 12.5% | 12.2% |
| Median | 11.2% | 11.5% |
| Interquartile 25% (IQ1) | 7.9% | 9.5% |
| Interquartile 75% (IQ3) | 16.1% | 14.8% |
| Interquartile Range (IQR) | 8.2% | 5.3% |
| Standard Deviation (Sample) | 6.9% | 4.6% |
| Standard Deviation (Population) | 6.9% | 4.6% |
Similar Demographics by Male Poverty
Demographics Similar to Malaysians by Male Poverty
In terms of male poverty, the demographic groups most similar to Malaysians are Immigrants from Eastern Africa (12.0%, a difference of 0.10%), Immigrants (12.0%, a difference of 0.33%), Immigrants from the Azores (12.0%, a difference of 0.44%), Panamanian (11.9%, a difference of 0.45%), and Moroccan (12.0%, a difference of 0.50%).
| Demographics | Rating | Rank | Male Poverty |
| Immigrants | Lebanon | 13.6 /100 | #200 | Poor 11.7% |
| Spaniards | 13.5 /100 | #201 | Poor 11.7% |
| Aleuts | 10.4 /100 | #202 | Poor 11.8% |
| Immigrants | Western Asia | 9.8 /100 | #203 | Tragic 11.8% |
| Immigrants | Uganda | 8.5 /100 | #204 | Tragic 11.8% |
| Panamanians | 6.2 /100 | #205 | Tragic 11.9% |
| Immigrants | Eastern Africa | 5.4 /100 | #206 | Tragic 12.0% |
| Malaysians | 5.2 /100 | #207 | Tragic 12.0% |
| Immigrants | Immigrants | 4.5 /100 | #208 | Tragic 12.0% |
| Immigrants | Azores | 4.3 /100 | #209 | Tragic 12.0% |
| Moroccans | 4.2 /100 | #210 | Tragic 12.0% |
| Immigrants | Panama | 4.0 /100 | #211 | Tragic 12.1% |
| Americans | 3.2 /100 | #212 | Tragic 12.1% |
| Immigrants | Nonimmigrants | 3.1 /100 | #213 | Tragic 12.1% |
| Japanese | 2.7 /100 | #214 | Tragic 12.2% |
Demographics Similar to Guyanese by Male Poverty
In terms of male poverty, the demographic groups most similar to Guyanese are Subsaharan African (13.3%, a difference of 0.22%), Immigrants from Jamaica (13.3%, a difference of 0.25%), Immigrants from Guyana (13.2%, a difference of 0.36%), Cree (13.3%, a difference of 0.47%), and Spanish American (13.4%, a difference of 0.50%).
| Demographics | Rating | Rank | Male Poverty |
| Spanish American Indians | 0.1 /100 | #262 | Tragic 13.1% |
| Central Americans | 0.1 /100 | #263 | Tragic 13.2% |
| Iroquois | 0.1 /100 | #264 | Tragic 13.2% |
| Jamaicans | 0.1 /100 | #265 | Tragic 13.2% |
| Immigrants | Guyana | 0.1 /100 | #266 | Tragic 13.2% |
| Immigrants | Jamaica | 0.1 /100 | #267 | Tragic 13.3% |
| Sub-Saharan Africans | 0.1 /100 | #268 | Tragic 13.3% |
| Guyanese | 0.0 /100 | #269 | Tragic 13.3% |
| Cree | 0.0 /100 | #270 | Tragic 13.3% |
| Spanish Americans | 0.0 /100 | #271 | Tragic 13.4% |
| Immigrants | Bahamas | 0.0 /100 | #272 | Tragic 13.5% |
| Chickasaw | 0.0 /100 | #273 | Tragic 13.5% |
| Immigrants | West Indies | 0.0 /100 | #274 | Tragic 13.5% |
| Barbadians | 0.0 /100 | #275 | Tragic 13.6% |
| Immigrants | Latin America | 0.0 /100 | #276 | Tragic 13.6% |