Welsh vs Guyanese Male Poverty
COMPARE
Welsh
Guyanese
Male Poverty
Male Poverty Comparison
Welsh
Guyanese
10.5%
MALE POVERTY
91.6/ 100
METRIC RATING
104th/ 347
METRIC RANK
13.3%
MALE POVERTY
0.0/ 100
METRIC RATING
269th/ 347
METRIC RANK
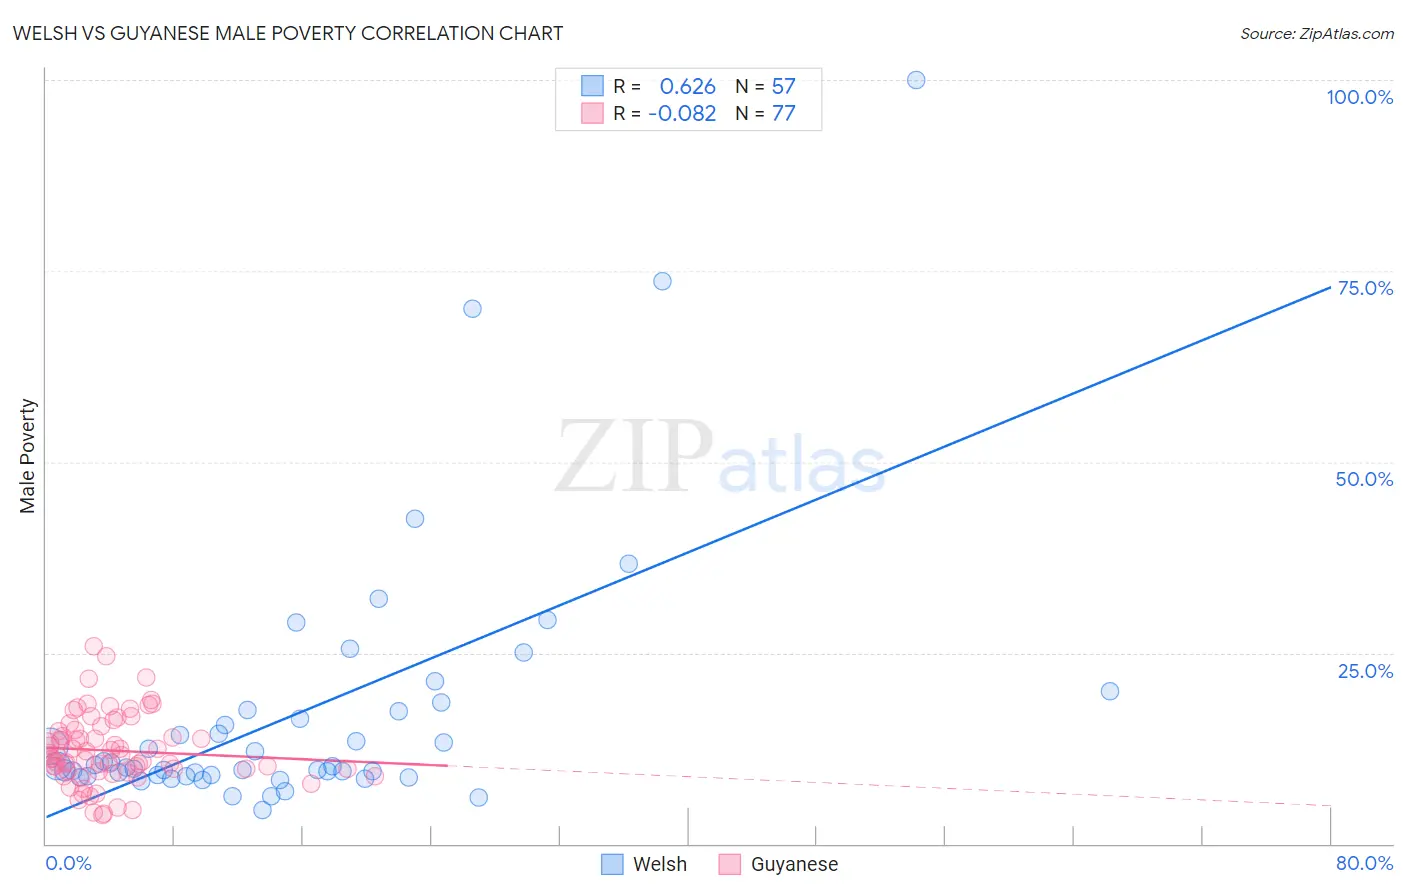
Welsh vs Guyanese Male Poverty Correlation Chart
The statistical analysis conducted on geographies consisting of 527,618,308 people shows a significant positive correlation between the proportion of Welsh and poverty level among males in the United States with a correlation coefficient (R) of 0.626 and weighted average of 10.5%. Similarly, the statistical analysis conducted on geographies consisting of 176,774,769 people shows a slight negative correlation between the proportion of Guyanese and poverty level among males in the United States with a correlation coefficient (R) of -0.082 and weighted average of 13.3%, a difference of 26.1%.
Male Poverty Correlation Summary
| Measurement | Welsh | Guyanese |
| Minimum | 4.4% | 3.8% |
| Maximum | 100.0% | 25.9% |
| Range | 95.6% | 22.1% |
| Mean | 17.1% | 12.2% |
| Median | 10.1% | 11.5% |
| Interquartile 25% (IQ1) | 9.0% | 9.5% |
| Interquartile 75% (IQ3) | 17.4% | 14.8% |
| Interquartile Range (IQR) | 8.5% | 5.3% |
| Standard Deviation (Sample) | 17.4% | 4.6% |
| Standard Deviation (Population) | 17.3% | 4.6% |
Similar Demographics by Male Poverty
Demographics Similar to Welsh by Male Poverty
In terms of male poverty, the demographic groups most similar to Welsh are Slavic (10.5%, a difference of 0.010%), Canadian (10.5%, a difference of 0.010%), French Canadian (10.5%, a difference of 0.11%), Immigrants from Zimbabwe (10.5%, a difference of 0.12%), and Immigrants from Southern Europe (10.5%, a difference of 0.12%).
| Demographics | Rating | Rank | Male Poverty |
| Romanians | 93.6 /100 | #97 | Exceptional 10.5% |
| Finns | 93.4 /100 | #98 | Exceptional 10.5% |
| Immigrants | Indonesia | 93.3 /100 | #99 | Exceptional 10.5% |
| Immigrants | Latvia | 92.8 /100 | #100 | Exceptional 10.5% |
| Immigrants | Zimbabwe | 92.0 /100 | #101 | Exceptional 10.5% |
| French Canadians | 91.9 /100 | #102 | Exceptional 10.5% |
| Slavs | 91.7 /100 | #103 | Exceptional 10.5% |
| Welsh | 91.6 /100 | #104 | Exceptional 10.5% |
| Canadians | 91.6 /100 | #105 | Exceptional 10.5% |
| Immigrants | Southern Europe | 91.3 /100 | #106 | Exceptional 10.5% |
| Laotians | 91.2 /100 | #107 | Exceptional 10.5% |
| Portuguese | 91.0 /100 | #108 | Exceptional 10.6% |
| Albanians | 90.6 /100 | #109 | Exceptional 10.6% |
| Argentineans | 90.1 /100 | #110 | Exceptional 10.6% |
| Immigrants | Argentina | 89.8 /100 | #111 | Excellent 10.6% |
Demographics Similar to Guyanese by Male Poverty
In terms of male poverty, the demographic groups most similar to Guyanese are Subsaharan African (13.3%, a difference of 0.22%), Immigrants from Jamaica (13.3%, a difference of 0.25%), Immigrants from Guyana (13.2%, a difference of 0.36%), Cree (13.3%, a difference of 0.47%), and Spanish American (13.4%, a difference of 0.50%).
| Demographics | Rating | Rank | Male Poverty |
| Spanish American Indians | 0.1 /100 | #262 | Tragic 13.1% |
| Central Americans | 0.1 /100 | #263 | Tragic 13.2% |
| Iroquois | 0.1 /100 | #264 | Tragic 13.2% |
| Jamaicans | 0.1 /100 | #265 | Tragic 13.2% |
| Immigrants | Guyana | 0.1 /100 | #266 | Tragic 13.2% |
| Immigrants | Jamaica | 0.1 /100 | #267 | Tragic 13.3% |
| Sub-Saharan Africans | 0.1 /100 | #268 | Tragic 13.3% |
| Guyanese | 0.0 /100 | #269 | Tragic 13.3% |
| Cree | 0.0 /100 | #270 | Tragic 13.3% |
| Spanish Americans | 0.0 /100 | #271 | Tragic 13.4% |
| Immigrants | Bahamas | 0.0 /100 | #272 | Tragic 13.5% |
| Chickasaw | 0.0 /100 | #273 | Tragic 13.5% |
| Immigrants | West Indies | 0.0 /100 | #274 | Tragic 13.5% |
| Barbadians | 0.0 /100 | #275 | Tragic 13.6% |
| Immigrants | Latin America | 0.0 /100 | #276 | Tragic 13.6% |