Immigrants from Turkey vs Cherokee Male Poverty
COMPARE
Immigrants from Turkey
Cherokee
Male Poverty
Male Poverty Comparison
Immigrants from Turkey
Cherokee
10.6%
MALE POVERTY
89.5/ 100
METRIC RATING
112th/ 347
METRIC RANK
13.1%
MALE POVERTY
0.1/ 100
METRIC RATING
259th/ 347
METRIC RANK
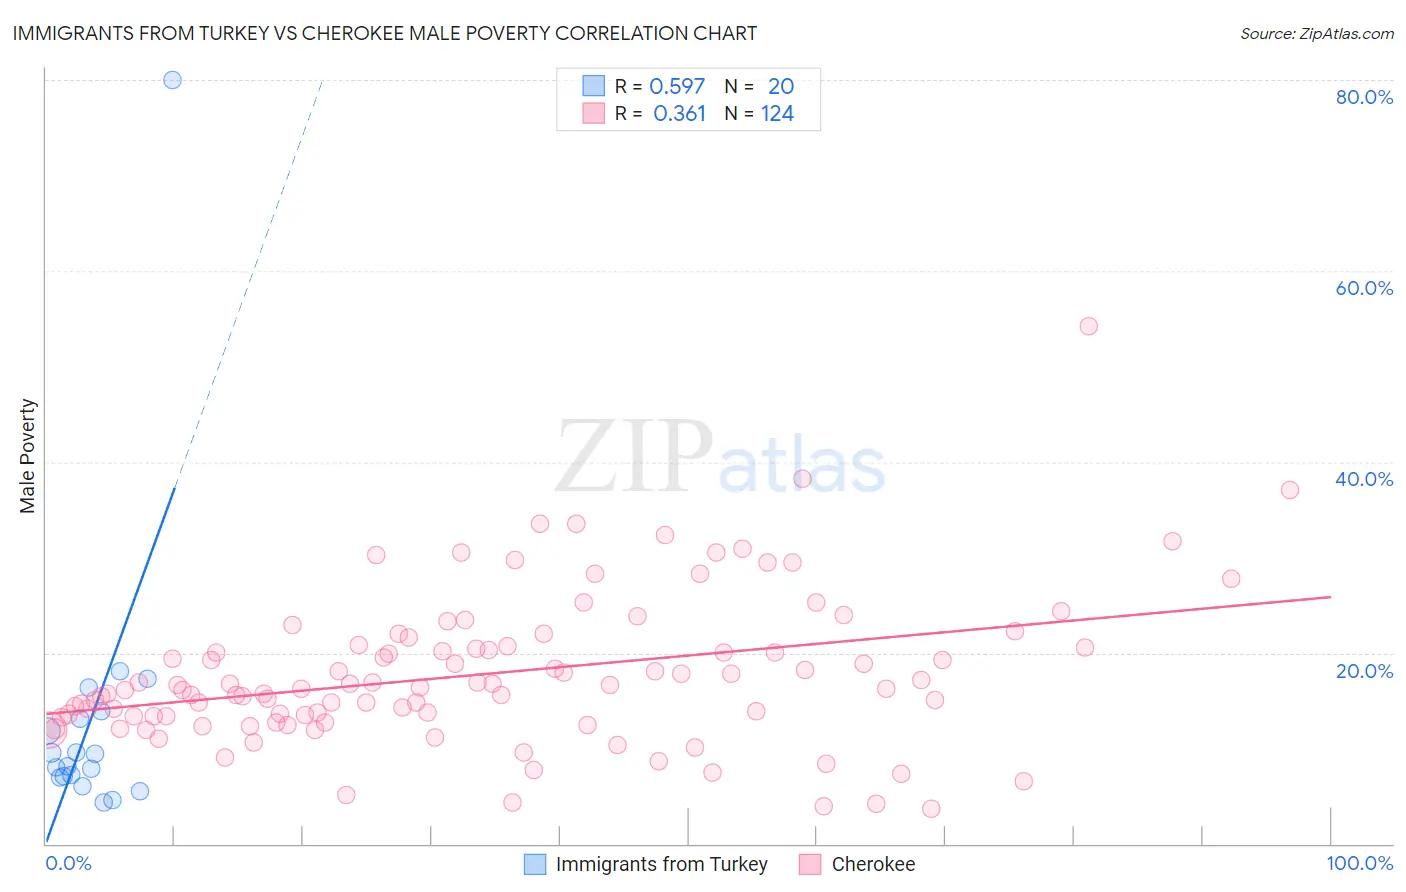
Immigrants from Turkey vs Cherokee Male Poverty Correlation Chart
The statistical analysis conducted on geographies consisting of 222,940,059 people shows a substantial positive correlation between the proportion of Immigrants from Turkey and poverty level among males in the United States with a correlation coefficient (R) of 0.597 and weighted average of 10.6%. Similarly, the statistical analysis conducted on geographies consisting of 493,122,545 people shows a mild positive correlation between the proportion of Cherokee and poverty level among males in the United States with a correlation coefficient (R) of 0.361 and weighted average of 13.1%, a difference of 23.5%.
Male Poverty Correlation Summary
| Measurement | Immigrants from Turkey | Cherokee |
| Minimum | 4.4% | 3.6% |
| Maximum | 80.0% | 54.2% |
| Range | 75.6% | 50.6% |
| Mean | 13.2% | 17.8% |
| Median | 8.7% | 16.3% |
| Interquartile 25% (IQ1) | 7.0% | 13.4% |
| Interquartile 75% (IQ3) | 13.5% | 20.6% |
| Interquartile Range (IQR) | 6.4% | 7.2% |
| Standard Deviation (Sample) | 16.2% | 7.8% |
| Standard Deviation (Population) | 15.8% | 7.8% |
Similar Demographics by Male Poverty
Demographics Similar to Immigrants from Turkey by Male Poverty
In terms of male poverty, the demographic groups most similar to Immigrants from Turkey are Immigrants from Argentina (10.6%, a difference of 0.080%), Palestinian (10.6%, a difference of 0.10%), Immigrants from Brazil (10.6%, a difference of 0.12%), Argentinean (10.6%, a difference of 0.19%), and Immigrants from Russia (10.6%, a difference of 0.24%).
| Demographics | Rating | Rank | Male Poverty |
| Canadians | 91.6 /100 | #105 | Exceptional 10.5% |
| Immigrants | Southern Europe | 91.3 /100 | #106 | Exceptional 10.5% |
| Laotians | 91.2 /100 | #107 | Exceptional 10.5% |
| Portuguese | 91.0 /100 | #108 | Exceptional 10.6% |
| Albanians | 90.6 /100 | #109 | Exceptional 10.6% |
| Argentineans | 90.1 /100 | #110 | Exceptional 10.6% |
| Immigrants | Argentina | 89.8 /100 | #111 | Excellent 10.6% |
| Immigrants | Turkey | 89.5 /100 | #112 | Excellent 10.6% |
| Palestinians | 89.1 /100 | #113 | Excellent 10.6% |
| Immigrants | Brazil | 89.0 /100 | #114 | Excellent 10.6% |
| Immigrants | Russia | 88.6 /100 | #115 | Excellent 10.6% |
| Sri Lankans | 88.1 /100 | #116 | Excellent 10.6% |
| Immigrants | South Eastern Asia | 88.1 /100 | #117 | Excellent 10.6% |
| Okinawans | 87.6 /100 | #118 | Excellent 10.7% |
| Immigrants | Hungary | 87.6 /100 | #119 | Excellent 10.7% |
Demographics Similar to Cherokee by Male Poverty
In terms of male poverty, the demographic groups most similar to Cherokee are Ottawa (13.1%, a difference of 0.11%), Trinidadian and Tobagonian (13.1%, a difference of 0.13%), Cape Verdean (13.1%, a difference of 0.16%), Spanish American Indian (13.1%, a difference of 0.18%), and Immigrants from Trinidad and Tobago (13.1%, a difference of 0.29%).
| Demographics | Rating | Rank | Male Poverty |
| Immigrants | Ecuador | 0.2 /100 | #252 | Tragic 12.9% |
| Immigrants | Ghana | 0.2 /100 | #253 | Tragic 12.9% |
| Mexican American Indians | 0.1 /100 | #254 | Tragic 13.0% |
| Immigrants | Liberia | 0.1 /100 | #255 | Tragic 13.0% |
| Immigrants | Burma/Myanmar | 0.1 /100 | #256 | Tragic 13.0% |
| Immigrants | Trinidad and Tobago | 0.1 /100 | #257 | Tragic 13.1% |
| Cape Verdeans | 0.1 /100 | #258 | Tragic 13.1% |
| Cherokee | 0.1 /100 | #259 | Tragic 13.1% |
| Ottawa | 0.1 /100 | #260 | Tragic 13.1% |
| Trinidadians and Tobagonians | 0.1 /100 | #261 | Tragic 13.1% |
| Spanish American Indians | 0.1 /100 | #262 | Tragic 13.1% |
| Central Americans | 0.1 /100 | #263 | Tragic 13.2% |
| Iroquois | 0.1 /100 | #264 | Tragic 13.2% |
| Jamaicans | 0.1 /100 | #265 | Tragic 13.2% |
| Immigrants | Guyana | 0.1 /100 | #266 | Tragic 13.2% |