Immigrants from Turkey vs Norwegian Male Poverty
COMPARE
Immigrants from Turkey
Norwegian
Male Poverty
Male Poverty Comparison
Immigrants from Turkey
Norwegians
10.6%
MALE POVERTY
89.5/ 100
METRIC RATING
112th/ 347
METRIC RANK
9.5%
MALE POVERTY
99.8/ 100
METRIC RATING
17th/ 347
METRIC RANK
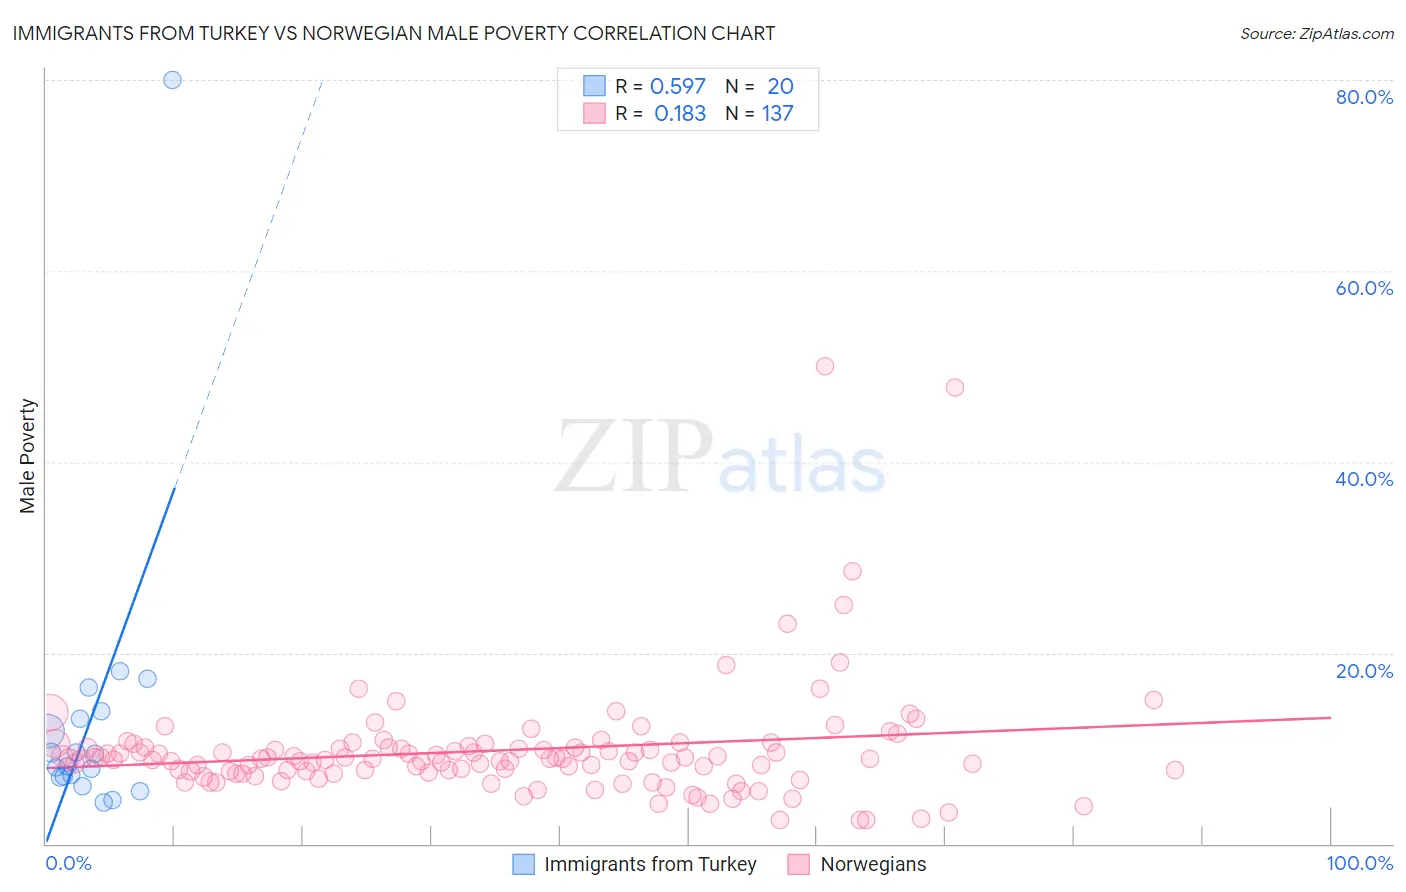
Immigrants from Turkey vs Norwegian Male Poverty Correlation Chart
The statistical analysis conducted on geographies consisting of 222,940,059 people shows a substantial positive correlation between the proportion of Immigrants from Turkey and poverty level among males in the United States with a correlation coefficient (R) of 0.597 and weighted average of 10.6%. Similarly, the statistical analysis conducted on geographies consisting of 532,206,209 people shows a poor positive correlation between the proportion of Norwegians and poverty level among males in the United States with a correlation coefficient (R) of 0.183 and weighted average of 9.5%, a difference of 11.3%.
Male Poverty Correlation Summary
| Measurement | Immigrants from Turkey | Norwegian |
| Minimum | 4.4% | 2.4% |
| Maximum | 80.0% | 50.0% |
| Range | 75.6% | 47.6% |
| Mean | 13.2% | 9.8% |
| Median | 8.7% | 8.9% |
| Interquartile 25% (IQ1) | 7.0% | 7.5% |
| Interquartile 75% (IQ3) | 13.5% | 10.1% |
| Interquartile Range (IQR) | 6.4% | 2.5% |
| Standard Deviation (Sample) | 16.2% | 6.1% |
| Standard Deviation (Population) | 15.8% | 6.1% |
Similar Demographics by Male Poverty
Demographics Similar to Immigrants from Turkey by Male Poverty
In terms of male poverty, the demographic groups most similar to Immigrants from Turkey are Immigrants from Argentina (10.6%, a difference of 0.080%), Palestinian (10.6%, a difference of 0.10%), Immigrants from Brazil (10.6%, a difference of 0.12%), Argentinean (10.6%, a difference of 0.19%), and Immigrants from Russia (10.6%, a difference of 0.24%).
| Demographics | Rating | Rank | Male Poverty |
| Canadians | 91.6 /100 | #105 | Exceptional 10.5% |
| Immigrants | Southern Europe | 91.3 /100 | #106 | Exceptional 10.5% |
| Laotians | 91.2 /100 | #107 | Exceptional 10.5% |
| Portuguese | 91.0 /100 | #108 | Exceptional 10.6% |
| Albanians | 90.6 /100 | #109 | Exceptional 10.6% |
| Argentineans | 90.1 /100 | #110 | Exceptional 10.6% |
| Immigrants | Argentina | 89.8 /100 | #111 | Excellent 10.6% |
| Immigrants | Turkey | 89.5 /100 | #112 | Excellent 10.6% |
| Palestinians | 89.1 /100 | #113 | Excellent 10.6% |
| Immigrants | Brazil | 89.0 /100 | #114 | Excellent 10.6% |
| Immigrants | Russia | 88.6 /100 | #115 | Excellent 10.6% |
| Sri Lankans | 88.1 /100 | #116 | Excellent 10.6% |
| Immigrants | South Eastern Asia | 88.1 /100 | #117 | Excellent 10.6% |
| Okinawans | 87.6 /100 | #118 | Excellent 10.7% |
| Immigrants | Hungary | 87.6 /100 | #119 | Excellent 10.7% |
Demographics Similar to Norwegians by Male Poverty
In terms of male poverty, the demographic groups most similar to Norwegians are Luxembourger (9.5%, a difference of 0.13%), Lithuanian (9.5%, a difference of 0.17%), Immigrants from Hong Kong (9.6%, a difference of 0.35%), Latvian (9.6%, a difference of 0.45%), and Bhutanese (9.5%, a difference of 0.65%).
| Demographics | Rating | Rank | Male Poverty |
| Bulgarians | 99.9 /100 | #10 | Exceptional 9.3% |
| Bolivians | 99.9 /100 | #11 | Exceptional 9.4% |
| Immigrants | Bolivia | 99.9 /100 | #12 | Exceptional 9.4% |
| Immigrants | Lithuania | 99.9 /100 | #13 | Exceptional 9.4% |
| Immigrants | North Macedonia | 99.8 /100 | #14 | Exceptional 9.4% |
| Bhutanese | 99.8 /100 | #15 | Exceptional 9.5% |
| Luxembourgers | 99.8 /100 | #16 | Exceptional 9.5% |
| Norwegians | 99.8 /100 | #17 | Exceptional 9.5% |
| Lithuanians | 99.8 /100 | #18 | Exceptional 9.5% |
| Immigrants | Hong Kong | 99.7 /100 | #19 | Exceptional 9.6% |
| Latvians | 99.7 /100 | #20 | Exceptional 9.6% |
| Immigrants | Scotland | 99.7 /100 | #21 | Exceptional 9.6% |
| Croatians | 99.7 /100 | #22 | Exceptional 9.6% |
| Italians | 99.7 /100 | #23 | Exceptional 9.6% |
| Swedes | 99.7 /100 | #24 | Exceptional 9.6% |