Fijian vs Guyanese Male Poverty
COMPARE
Fijian
Guyanese
Male Poverty
Male Poverty Comparison
Fijians
Guyanese
12.6%
MALE POVERTY
0.6/ 100
METRIC RATING
233rd/ 347
METRIC RANK
13.3%
MALE POVERTY
0.0/ 100
METRIC RATING
269th/ 347
METRIC RANK
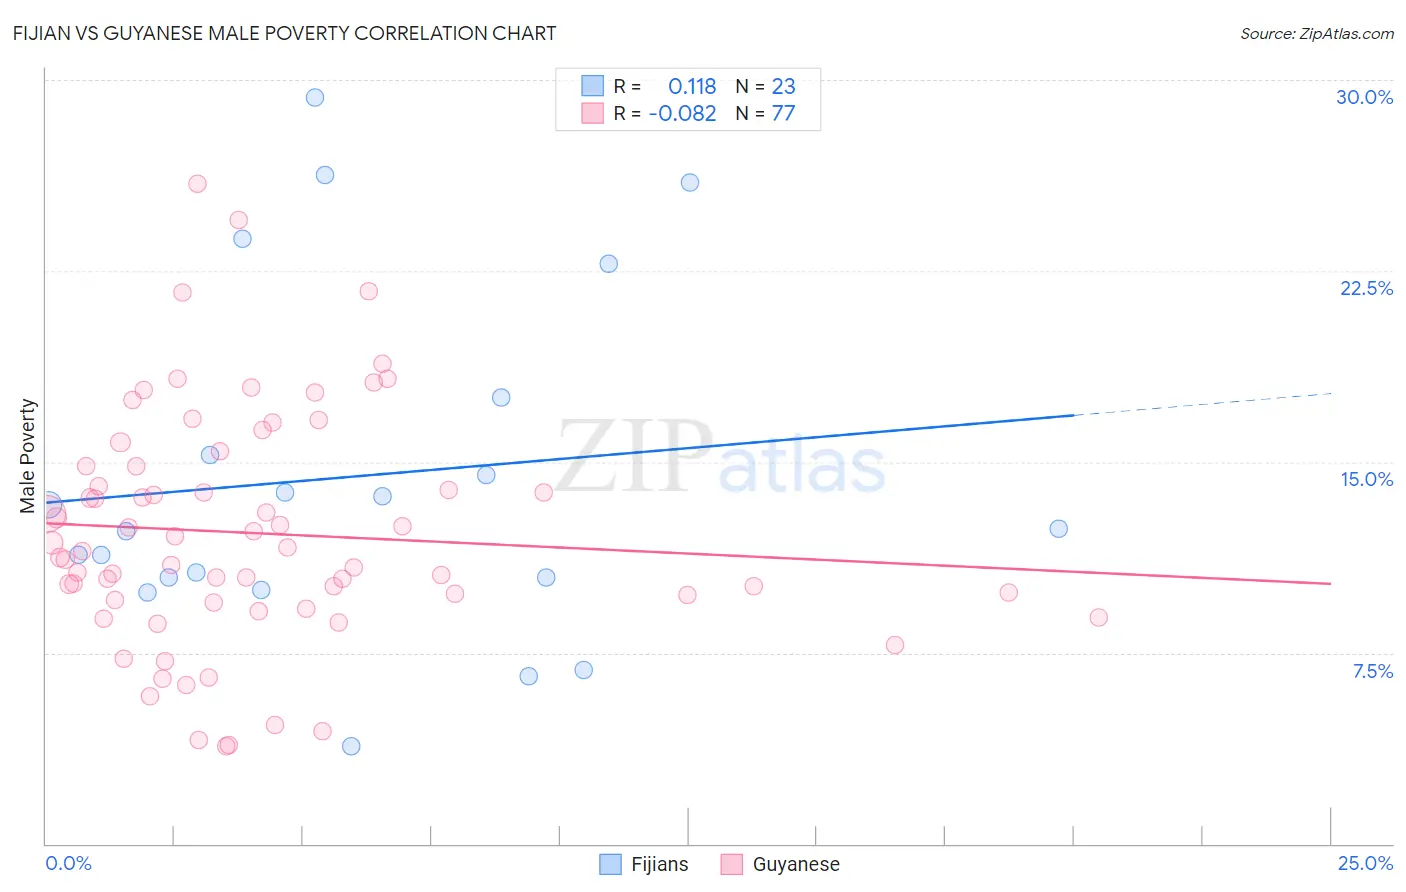
Fijian vs Guyanese Male Poverty Correlation Chart
The statistical analysis conducted on geographies consisting of 55,945,809 people shows a poor positive correlation between the proportion of Fijians and poverty level among males in the United States with a correlation coefficient (R) of 0.118 and weighted average of 12.6%. Similarly, the statistical analysis conducted on geographies consisting of 176,774,769 people shows a slight negative correlation between the proportion of Guyanese and poverty level among males in the United States with a correlation coefficient (R) of -0.082 and weighted average of 13.3%, a difference of 5.5%.
Male Poverty Correlation Summary
| Measurement | Fijian | Guyanese |
| Minimum | 3.8% | 3.8% |
| Maximum | 29.3% | 25.9% |
| Range | 25.4% | 22.1% |
| Mean | 14.4% | 12.2% |
| Median | 12.4% | 11.5% |
| Interquartile 25% (IQ1) | 10.4% | 9.5% |
| Interquartile 75% (IQ3) | 17.5% | 14.8% |
| Interquartile Range (IQR) | 7.1% | 5.3% |
| Standard Deviation (Sample) | 6.8% | 4.6% |
| Standard Deviation (Population) | 6.6% | 4.6% |
Similar Demographics by Male Poverty
Demographics Similar to Fijians by Male Poverty
In terms of male poverty, the demographic groups most similar to Fijians are Nicaraguan (12.6%, a difference of 0.050%), Immigrants from Armenia (12.6%, a difference of 0.060%), Salvadoran (12.6%, a difference of 0.16%), Immigrants from Laos (12.6%, a difference of 0.43%), and Immigrants from Saudi Arabia (12.7%, a difference of 0.68%).
| Demographics | Rating | Rank | Male Poverty |
| Nigerians | 1.4 /100 | #226 | Tragic 12.3% |
| Alaska Natives | 1.4 /100 | #227 | Tragic 12.4% |
| Alsatians | 1.3 /100 | #228 | Tragic 12.4% |
| Cubans | 1.3 /100 | #229 | Tragic 12.4% |
| Marshallese | 0.8 /100 | #230 | Tragic 12.5% |
| Salvadorans | 0.6 /100 | #231 | Tragic 12.6% |
| Nicaraguans | 0.6 /100 | #232 | Tragic 12.6% |
| Fijians | 0.6 /100 | #233 | Tragic 12.6% |
| Immigrants | Armenia | 0.6 /100 | #234 | Tragic 12.6% |
| Immigrants | Laos | 0.5 /100 | #235 | Tragic 12.6% |
| Immigrants | Saudi Arabia | 0.4 /100 | #236 | Tragic 12.7% |
| French American Indians | 0.4 /100 | #237 | Tragic 12.7% |
| Ecuadorians | 0.4 /100 | #238 | Tragic 12.7% |
| Ghanaians | 0.4 /100 | #239 | Tragic 12.7% |
| Immigrants | Middle Africa | 0.4 /100 | #240 | Tragic 12.7% |
Demographics Similar to Guyanese by Male Poverty
In terms of male poverty, the demographic groups most similar to Guyanese are Subsaharan African (13.3%, a difference of 0.22%), Immigrants from Jamaica (13.3%, a difference of 0.25%), Immigrants from Guyana (13.2%, a difference of 0.36%), Cree (13.3%, a difference of 0.47%), and Spanish American (13.4%, a difference of 0.50%).
| Demographics | Rating | Rank | Male Poverty |
| Spanish American Indians | 0.1 /100 | #262 | Tragic 13.1% |
| Central Americans | 0.1 /100 | #263 | Tragic 13.2% |
| Iroquois | 0.1 /100 | #264 | Tragic 13.2% |
| Jamaicans | 0.1 /100 | #265 | Tragic 13.2% |
| Immigrants | Guyana | 0.1 /100 | #266 | Tragic 13.2% |
| Immigrants | Jamaica | 0.1 /100 | #267 | Tragic 13.3% |
| Sub-Saharan Africans | 0.1 /100 | #268 | Tragic 13.3% |
| Guyanese | 0.0 /100 | #269 | Tragic 13.3% |
| Cree | 0.0 /100 | #270 | Tragic 13.3% |
| Spanish Americans | 0.0 /100 | #271 | Tragic 13.4% |
| Immigrants | Bahamas | 0.0 /100 | #272 | Tragic 13.5% |
| Chickasaw | 0.0 /100 | #273 | Tragic 13.5% |
| Immigrants | West Indies | 0.0 /100 | #274 | Tragic 13.5% |
| Barbadians | 0.0 /100 | #275 | Tragic 13.6% |
| Immigrants | Latin America | 0.0 /100 | #276 | Tragic 13.6% |