Immigrants from Turkey vs Yuman Male Poverty
COMPARE
Immigrants from Turkey
Yuman
Male Poverty
Male Poverty Comparison
Immigrants from Turkey
Yuman
10.6%
MALE POVERTY
89.5/ 100
METRIC RATING
112th/ 347
METRIC RANK
19.5%
MALE POVERTY
0.0/ 100
METRIC RATING
339th/ 347
METRIC RANK
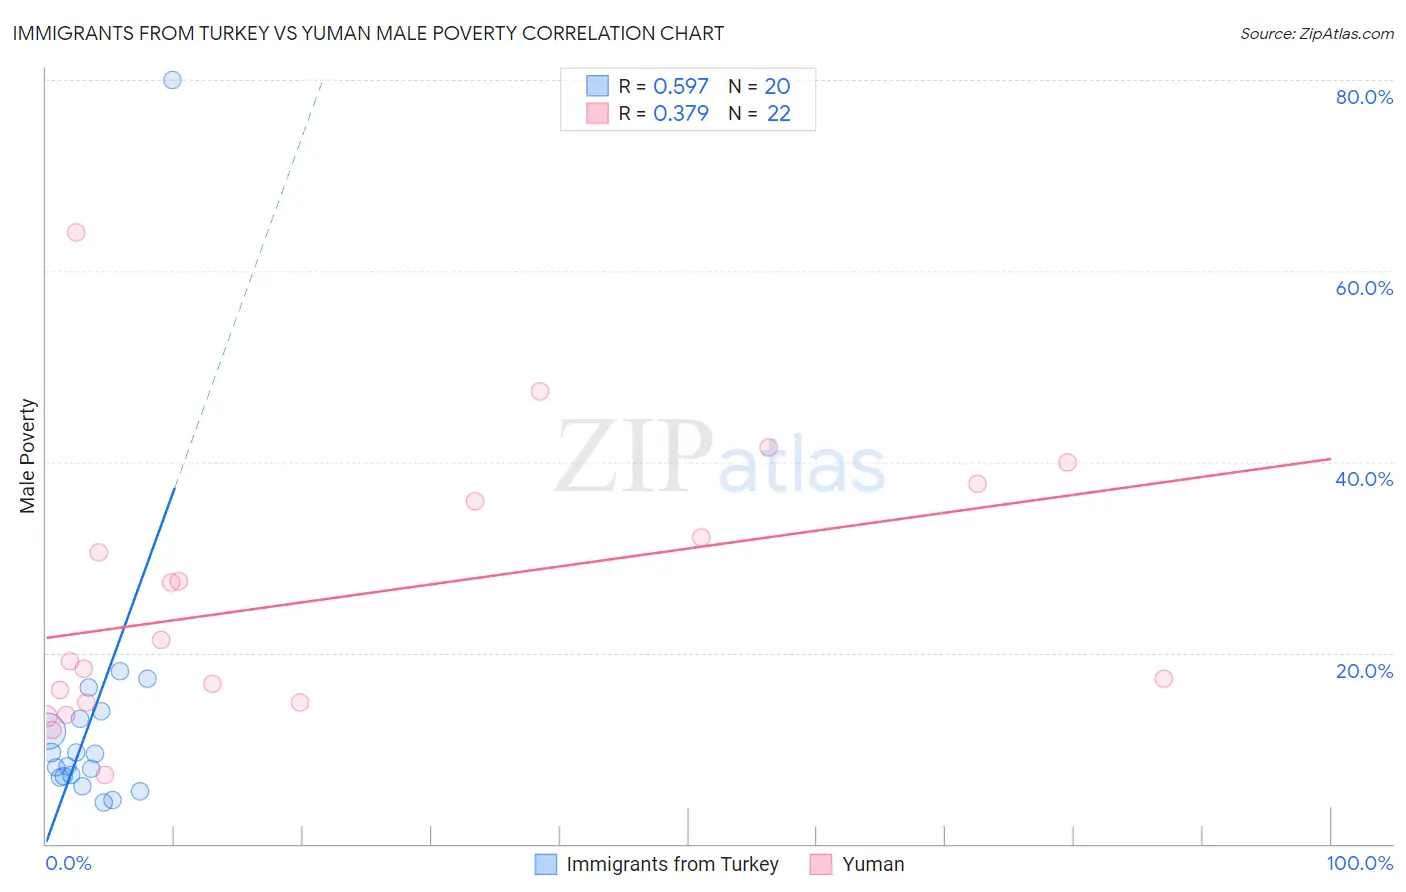
Immigrants from Turkey vs Yuman Male Poverty Correlation Chart
The statistical analysis conducted on geographies consisting of 222,940,059 people shows a substantial positive correlation between the proportion of Immigrants from Turkey and poverty level among males in the United States with a correlation coefficient (R) of 0.597 and weighted average of 10.6%. Similarly, the statistical analysis conducted on geographies consisting of 40,667,603 people shows a mild positive correlation between the proportion of Yuman and poverty level among males in the United States with a correlation coefficient (R) of 0.379 and weighted average of 19.5%, a difference of 84.4%.
Male Poverty Correlation Summary
| Measurement | Immigrants from Turkey | Yuman |
| Minimum | 4.4% | 7.2% |
| Maximum | 80.0% | 64.1% |
| Range | 75.6% | 56.9% |
| Mean | 13.2% | 25.8% |
| Median | 8.7% | 20.2% |
| Interquartile 25% (IQ1) | 7.0% | 14.8% |
| Interquartile 75% (IQ3) | 13.5% | 35.9% |
| Interquartile Range (IQR) | 6.4% | 21.1% |
| Standard Deviation (Sample) | 16.2% | 14.1% |
| Standard Deviation (Population) | 15.8% | 13.7% |
Similar Demographics by Male Poverty
Demographics Similar to Immigrants from Turkey by Male Poverty
In terms of male poverty, the demographic groups most similar to Immigrants from Turkey are Immigrants from Argentina (10.6%, a difference of 0.080%), Palestinian (10.6%, a difference of 0.10%), Immigrants from Brazil (10.6%, a difference of 0.12%), Argentinean (10.6%, a difference of 0.19%), and Immigrants from Russia (10.6%, a difference of 0.24%).
| Demographics | Rating | Rank | Male Poverty |
| Canadians | 91.6 /100 | #105 | Exceptional 10.5% |
| Immigrants | Southern Europe | 91.3 /100 | #106 | Exceptional 10.5% |
| Laotians | 91.2 /100 | #107 | Exceptional 10.5% |
| Portuguese | 91.0 /100 | #108 | Exceptional 10.6% |
| Albanians | 90.6 /100 | #109 | Exceptional 10.6% |
| Argentineans | 90.1 /100 | #110 | Exceptional 10.6% |
| Immigrants | Argentina | 89.8 /100 | #111 | Excellent 10.6% |
| Immigrants | Turkey | 89.5 /100 | #112 | Excellent 10.6% |
| Palestinians | 89.1 /100 | #113 | Excellent 10.6% |
| Immigrants | Brazil | 89.0 /100 | #114 | Excellent 10.6% |
| Immigrants | Russia | 88.6 /100 | #115 | Excellent 10.6% |
| Sri Lankans | 88.1 /100 | #116 | Excellent 10.6% |
| Immigrants | South Eastern Asia | 88.1 /100 | #117 | Excellent 10.6% |
| Okinawans | 87.6 /100 | #118 | Excellent 10.7% |
| Immigrants | Hungary | 87.6 /100 | #119 | Excellent 10.7% |
Demographics Similar to Yuman by Male Poverty
In terms of male poverty, the demographic groups most similar to Yuman are Crow (19.1%, a difference of 2.2%), Immigrants from Yemen (20.1%, a difference of 3.1%), Lumbee (20.2%, a difference of 3.4%), Pima (20.4%, a difference of 4.2%), and Yup'ik (20.4%, a difference of 4.3%).
| Demographics | Rating | Rank | Male Poverty |
| Houma | 0.0 /100 | #332 | Tragic 16.7% |
| Natives/Alaskans | 0.0 /100 | #333 | Tragic 16.9% |
| Cheyenne | 0.0 /100 | #334 | Tragic 17.6% |
| Apache | 0.0 /100 | #335 | Tragic 17.7% |
| Pueblo | 0.0 /100 | #336 | Tragic 18.5% |
| Sioux | 0.0 /100 | #337 | Tragic 18.7% |
| Crow | 0.0 /100 | #338 | Tragic 19.1% |
| Yuman | 0.0 /100 | #339 | Tragic 19.5% |
| Immigrants | Yemen | 0.0 /100 | #340 | Tragic 20.1% |
| Lumbee | 0.0 /100 | #341 | Tragic 20.2% |
| Pima | 0.0 /100 | #342 | Tragic 20.4% |
| Yup'ik | 0.0 /100 | #343 | Tragic 20.4% |
| Hopi | 0.0 /100 | #344 | Tragic 20.8% |
| Puerto Ricans | 0.0 /100 | #345 | Tragic 22.0% |
| Navajo | 0.0 /100 | #346 | Tragic 22.3% |