Canadian vs Immigrants from Cuba Married-Couple Family Poverty
COMPARE
Canadian
Immigrants from Cuba
Married-Couple Family Poverty
Married-Couple Family Poverty Comparison
Canadians
Immigrants from Cuba
4.5%
MARRIED-COUPLE FAMILY POVERTY
98.8/ 100
METRIC RATING
82nd/ 347
METRIC RANK
7.5%
MARRIED-COUPLE FAMILY POVERTY
0.0/ 100
METRIC RATING
325th/ 347
METRIC RANK
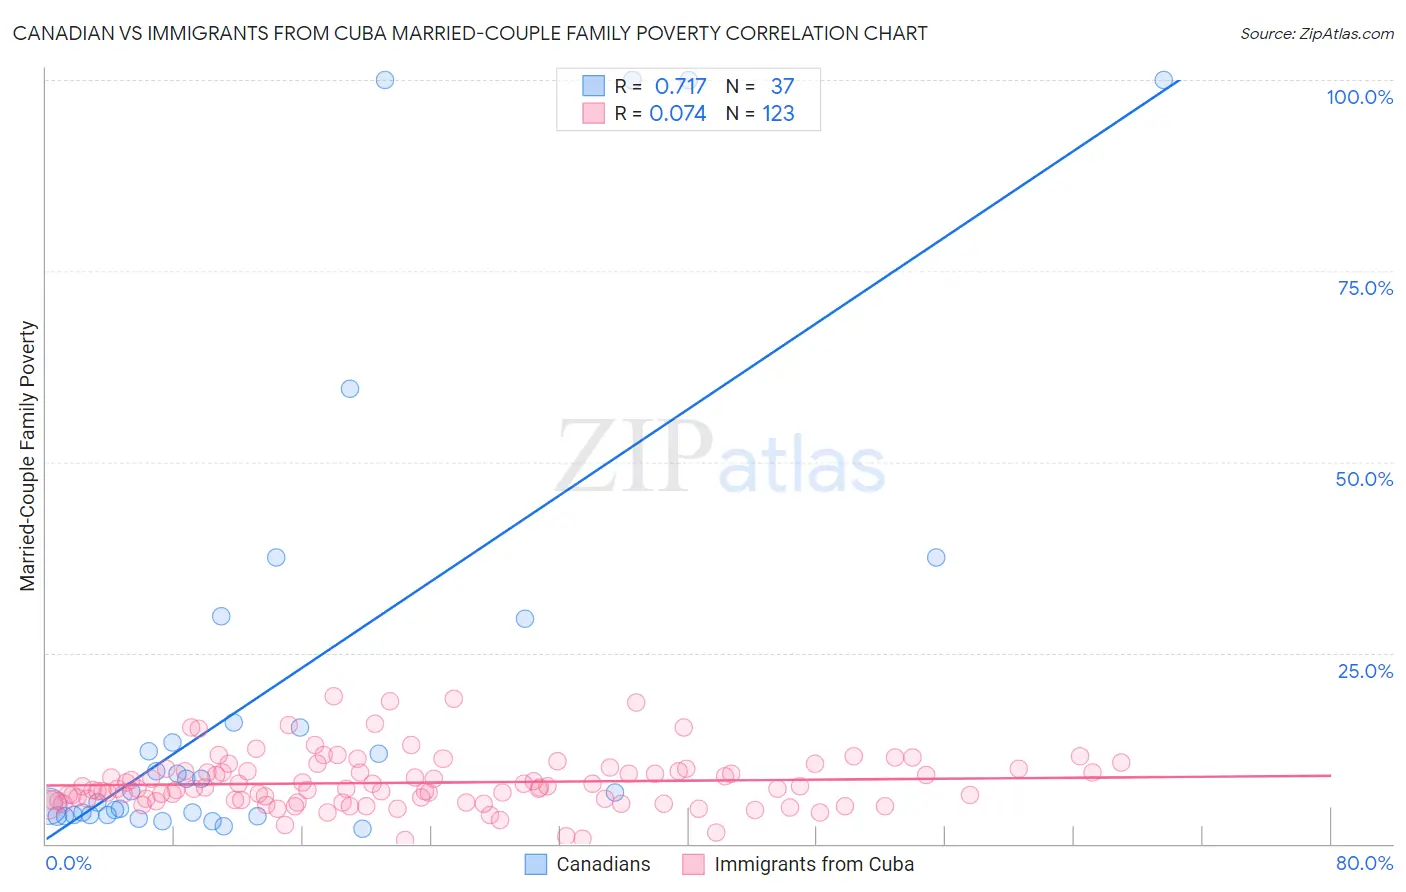
Canadian vs Immigrants from Cuba Married-Couple Family Poverty Correlation Chart
The statistical analysis conducted on geographies consisting of 431,987,986 people shows a strong positive correlation between the proportion of Canadians and poverty level among married-couple families in the United States with a correlation coefficient (R) of 0.717 and weighted average of 4.5%. Similarly, the statistical analysis conducted on geographies consisting of 324,285,168 people shows a slight positive correlation between the proportion of Immigrants from Cuba and poverty level among married-couple families in the United States with a correlation coefficient (R) of 0.074 and weighted average of 7.5%, a difference of 64.4%.
Married-Couple Family Poverty Correlation Summary
| Measurement | Canadian | Immigrants from Cuba |
| Minimum | 2.0% | 0.42% |
| Maximum | 100.0% | 19.2% |
| Range | 98.0% | 18.8% |
| Mean | 20.9% | 8.0% |
| Median | 6.9% | 7.3% |
| Interquartile 25% (IQ1) | 3.7% | 5.6% |
| Interquartile 75% (IQ3) | 22.6% | 9.6% |
| Interquartile Range (IQR) | 18.9% | 3.9% |
| Standard Deviation (Sample) | 30.5% | 3.6% |
| Standard Deviation (Population) | 30.1% | 3.6% |
Similar Demographics by Married-Couple Family Poverty
Demographics Similar to Canadians by Married-Couple Family Poverty
In terms of married-couple family poverty, the demographic groups most similar to Canadians are Immigrants from Denmark (4.6%, a difference of 0.16%), Immigrants from Greece (4.5%, a difference of 0.25%), Immigrants from Croatia (4.6%, a difference of 0.29%), Icelander (4.5%, a difference of 0.39%), and Immigrants from Iran (4.5%, a difference of 0.45%).
| Demographics | Rating | Rank | Married-Couple Family Poverty |
| Cambodians | 99.2 /100 | #75 | Exceptional 4.5% |
| Immigrants | South Africa | 99.1 /100 | #76 | Exceptional 4.5% |
| Immigrants | Latvia | 99.1 /100 | #77 | Exceptional 4.5% |
| Scotch-Irish | 99.1 /100 | #78 | Exceptional 4.5% |
| Immigrants | Iran | 99.0 /100 | #79 | Exceptional 4.5% |
| Icelanders | 99.0 /100 | #80 | Exceptional 4.5% |
| Immigrants | Greece | 98.9 /100 | #81 | Exceptional 4.5% |
| Canadians | 98.8 /100 | #82 | Exceptional 4.5% |
| Immigrants | Denmark | 98.8 /100 | #83 | Exceptional 4.6% |
| Immigrants | Croatia | 98.7 /100 | #84 | Exceptional 4.6% |
| South Africans | 98.7 /100 | #85 | Exceptional 4.6% |
| Immigrants | Turkey | 98.6 /100 | #86 | Exceptional 4.6% |
| Immigrants | North Macedonia | 98.6 /100 | #87 | Exceptional 4.6% |
| Bolivians | 98.6 /100 | #88 | Exceptional 4.6% |
| Immigrants | Czechoslovakia | 98.5 /100 | #89 | Exceptional 4.6% |
Demographics Similar to Immigrants from Cuba by Married-Couple Family Poverty
In terms of married-couple family poverty, the demographic groups most similar to Immigrants from Cuba are Immigrants from Bangladesh (7.5%, a difference of 0.20%), Hispanic or Latino (7.5%, a difference of 0.20%), Immigrants from Central America (7.4%, a difference of 0.53%), Vietnamese (7.4%, a difference of 0.63%), and Immigrants from Mexico (7.6%, a difference of 1.4%).
| Demographics | Rating | Rank | Married-Couple Family Poverty |
| Immigrants | Guatemala | 0.0 /100 | #318 | Tragic 7.2% |
| Immigrants | Latin America | 0.0 /100 | #319 | Tragic 7.2% |
| Immigrants | Grenada | 0.0 /100 | #320 | Tragic 7.3% |
| Immigrants | Caribbean | 0.0 /100 | #321 | Tragic 7.3% |
| Immigrants | Honduras | 0.0 /100 | #322 | Tragic 7.3% |
| Vietnamese | 0.0 /100 | #323 | Tragic 7.4% |
| Immigrants | Central America | 0.0 /100 | #324 | Tragic 7.4% |
| Immigrants | Cuba | 0.0 /100 | #325 | Tragic 7.5% |
| Immigrants | Bangladesh | 0.0 /100 | #326 | Tragic 7.5% |
| Hispanics or Latinos | 0.0 /100 | #327 | Tragic 7.5% |
| Immigrants | Mexico | 0.0 /100 | #328 | Tragic 7.6% |
| Natives/Alaskans | 0.0 /100 | #329 | Tragic 8.2% |
| Paiute | 0.0 /100 | #330 | Tragic 8.3% |
| Central American Indians | 0.0 /100 | #331 | Tragic 8.3% |
| Dominicans | 0.0 /100 | #332 | Tragic 8.3% |