Pakistani vs Immigrants from Cuba Married-Couple Family Poverty
COMPARE
Pakistani
Immigrants from Cuba
Married-Couple Family Poverty
Married-Couple Family Poverty Comparison
Pakistanis
Immigrants from Cuba
4.7%
MARRIED-COUPLE FAMILY POVERTY
96.2/ 100
METRIC RATING
111th/ 347
METRIC RANK
7.5%
MARRIED-COUPLE FAMILY POVERTY
0.0/ 100
METRIC RATING
325th/ 347
METRIC RANK
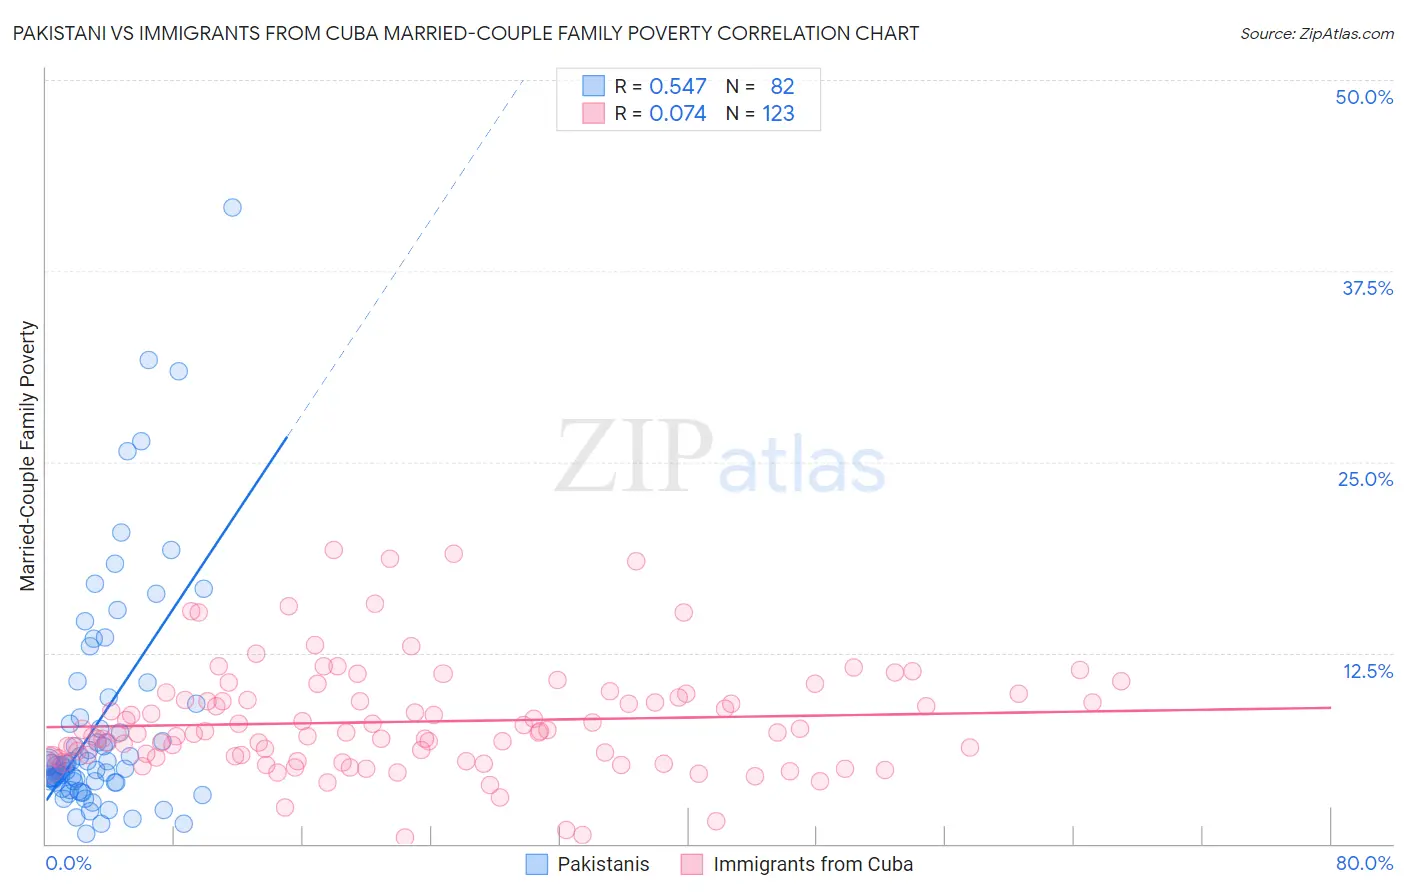
Pakistani vs Immigrants from Cuba Married-Couple Family Poverty Correlation Chart
The statistical analysis conducted on geographies consisting of 333,416,483 people shows a substantial positive correlation between the proportion of Pakistanis and poverty level among married-couple families in the United States with a correlation coefficient (R) of 0.547 and weighted average of 4.7%. Similarly, the statistical analysis conducted on geographies consisting of 324,285,168 people shows a slight positive correlation between the proportion of Immigrants from Cuba and poverty level among married-couple families in the United States with a correlation coefficient (R) of 0.074 and weighted average of 7.5%, a difference of 57.9%.
Married-Couple Family Poverty Correlation Summary
| Measurement | Pakistani | Immigrants from Cuba |
| Minimum | 0.63% | 0.42% |
| Maximum | 41.7% | 19.2% |
| Range | 41.0% | 18.8% |
| Mean | 7.9% | 8.0% |
| Median | 5.2% | 7.3% |
| Interquartile 25% (IQ1) | 4.0% | 5.6% |
| Interquartile 75% (IQ3) | 8.3% | 9.6% |
| Interquartile Range (IQR) | 4.3% | 3.9% |
| Standard Deviation (Sample) | 7.6% | 3.6% |
| Standard Deviation (Population) | 7.5% | 3.6% |
Similar Demographics by Married-Couple Family Poverty
Demographics Similar to Pakistanis by Married-Couple Family Poverty
In terms of married-couple family poverty, the demographic groups most similar to Pakistanis are Immigrants from Bolivia (4.7%, a difference of 0.040%), Tongan (4.7%, a difference of 0.18%), Immigrants from Hong Kong (4.7%, a difference of 0.20%), Immigrants from Nepal (4.7%, a difference of 0.25%), and Laotian (4.7%, a difference of 0.40%).
| Demographics | Rating | Rank | Married-Couple Family Poverty |
| Immigrants | Moldova | 97.1 /100 | #104 | Exceptional 4.7% |
| Aleuts | 97.0 /100 | #105 | Exceptional 4.7% |
| Immigrants | France | 96.9 /100 | #106 | Exceptional 4.7% |
| Immigrants | Germany | 96.8 /100 | #107 | Exceptional 4.7% |
| Laotians | 96.6 /100 | #108 | Exceptional 4.7% |
| Immigrants | Hong Kong | 96.4 /100 | #109 | Exceptional 4.7% |
| Immigrants | Bolivia | 96.2 /100 | #110 | Exceptional 4.7% |
| Pakistanis | 96.2 /100 | #111 | Exceptional 4.7% |
| Tongans | 95.9 /100 | #112 | Exceptional 4.7% |
| Immigrants | Nepal | 95.9 /100 | #113 | Exceptional 4.7% |
| Immigrants | Indonesia | 95.1 /100 | #114 | Exceptional 4.8% |
| Taiwanese | 94.8 /100 | #115 | Exceptional 4.8% |
| Celtics | 94.8 /100 | #116 | Exceptional 4.8% |
| Kenyans | 94.7 /100 | #117 | Exceptional 4.8% |
| Immigrants | Philippines | 94.6 /100 | #118 | Exceptional 4.8% |
Demographics Similar to Immigrants from Cuba by Married-Couple Family Poverty
In terms of married-couple family poverty, the demographic groups most similar to Immigrants from Cuba are Immigrants from Bangladesh (7.5%, a difference of 0.20%), Hispanic or Latino (7.5%, a difference of 0.20%), Immigrants from Central America (7.4%, a difference of 0.53%), Vietnamese (7.4%, a difference of 0.63%), and Immigrants from Mexico (7.6%, a difference of 1.4%).
| Demographics | Rating | Rank | Married-Couple Family Poverty |
| Immigrants | Guatemala | 0.0 /100 | #318 | Tragic 7.2% |
| Immigrants | Latin America | 0.0 /100 | #319 | Tragic 7.2% |
| Immigrants | Grenada | 0.0 /100 | #320 | Tragic 7.3% |
| Immigrants | Caribbean | 0.0 /100 | #321 | Tragic 7.3% |
| Immigrants | Honduras | 0.0 /100 | #322 | Tragic 7.3% |
| Vietnamese | 0.0 /100 | #323 | Tragic 7.4% |
| Immigrants | Central America | 0.0 /100 | #324 | Tragic 7.4% |
| Immigrants | Cuba | 0.0 /100 | #325 | Tragic 7.5% |
| Immigrants | Bangladesh | 0.0 /100 | #326 | Tragic 7.5% |
| Hispanics or Latinos | 0.0 /100 | #327 | Tragic 7.5% |
| Immigrants | Mexico | 0.0 /100 | #328 | Tragic 7.6% |
| Natives/Alaskans | 0.0 /100 | #329 | Tragic 8.2% |
| Paiute | 0.0 /100 | #330 | Tragic 8.3% |
| Central American Indians | 0.0 /100 | #331 | Tragic 8.3% |
| Dominicans | 0.0 /100 | #332 | Tragic 8.3% |