Immigrants from Switzerland vs Immigrants from Belize Median Male Earnings
COMPARE
Immigrants from Switzerland
Immigrants from Belize
Median Male Earnings
Median Male Earnings Comparison
Immigrants from Switzerland
Immigrants from Belize
$63,944
MEDIAN MALE EARNINGS
100.0/ 100
METRIC RATING
27th/ 347
METRIC RANK
$47,809
MEDIAN MALE EARNINGS
0.1/ 100
METRIC RATING
290th/ 347
METRIC RANK
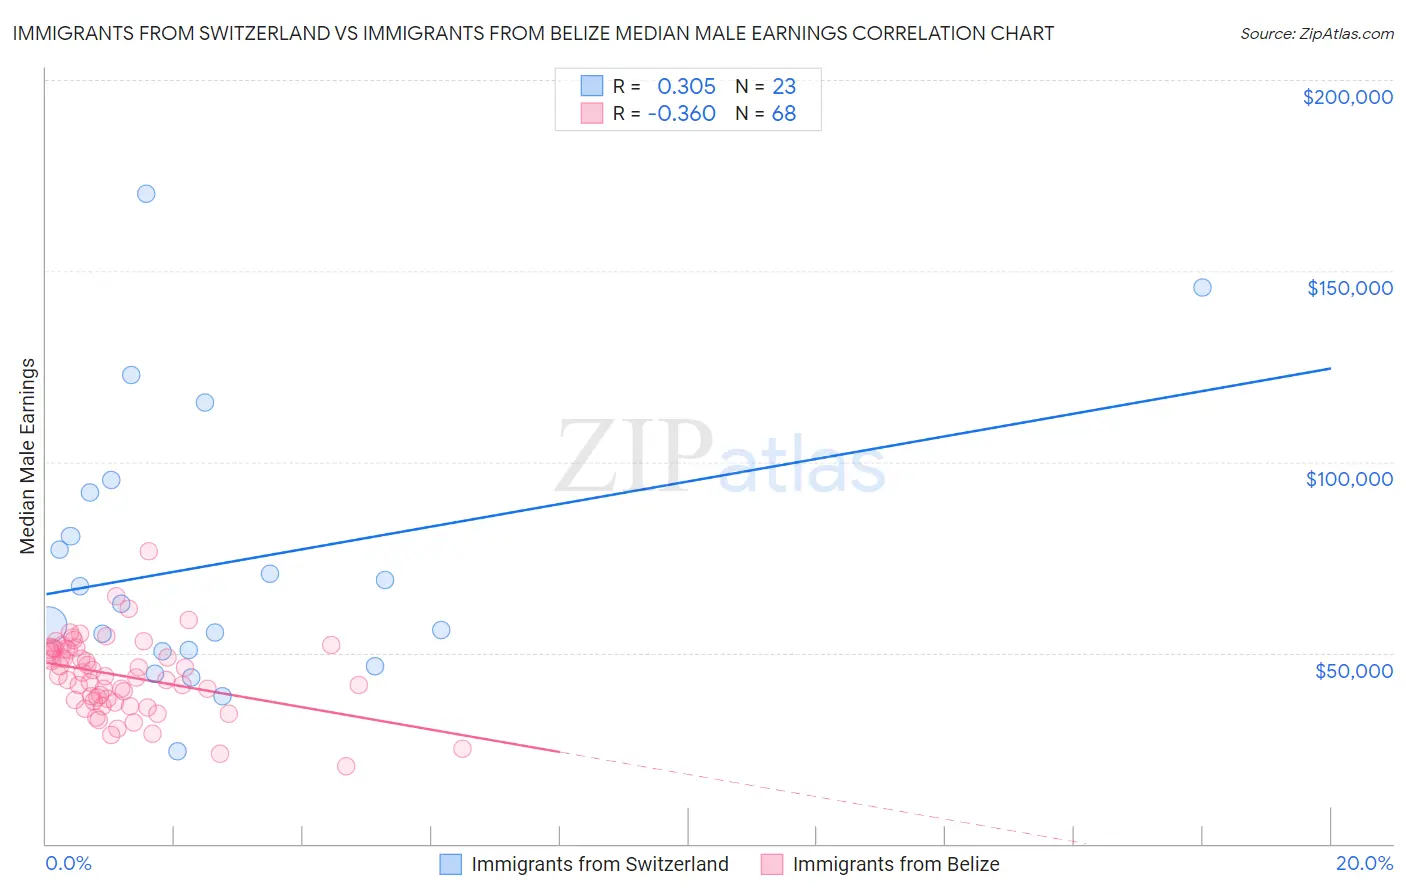
Immigrants from Switzerland vs Immigrants from Belize Median Male Earnings Correlation Chart
The statistical analysis conducted on geographies consisting of 148,046,758 people shows a mild positive correlation between the proportion of Immigrants from Switzerland and median male earnings in the United States with a correlation coefficient (R) of 0.305 and weighted average of $63,944. Similarly, the statistical analysis conducted on geographies consisting of 130,305,697 people shows a mild negative correlation between the proportion of Immigrants from Belize and median male earnings in the United States with a correlation coefficient (R) of -0.360 and weighted average of $47,809, a difference of 33.8%.
Median Male Earnings Correlation Summary
| Measurement | Immigrants from Switzerland | Immigrants from Belize |
| Minimum | $24,152 | $20,292 |
| Maximum | $170,239 | $76,469 |
| Range | $146,087 | $56,177 |
| Mean | $73,519 | $44,004 |
| Median | $62,840 | $43,946 |
| Interquartile 25% (IQ1) | $50,348 | $37,392 |
| Interquartile 75% (IQ3) | $91,948 | $51,048 |
| Interquartile Range (IQR) | $41,600 | $13,656 |
| Standard Deviation (Sample) | $35,831 | $9,886 |
| Standard Deviation (Population) | $35,043 | $9,813 |
Similar Demographics by Median Male Earnings
Demographics Similar to Immigrants from Switzerland by Median Male Earnings
In terms of median male earnings, the demographic groups most similar to Immigrants from Switzerland are Russian ($63,939, a difference of 0.010%), Asian ($63,827, a difference of 0.18%), Immigrants from France ($63,715, a difference of 0.36%), Turkish ($64,253, a difference of 0.48%), and Latvian ($63,498, a difference of 0.70%).
| Demographics | Rating | Rank | Median Male Earnings |
| Immigrants | Japan | 100.0 /100 | #20 | Exceptional $65,518 |
| Immigrants | Sweden | 100.0 /100 | #21 | Exceptional $65,406 |
| Burmese | 100.0 /100 | #22 | Exceptional $65,236 |
| Immigrants | Korea | 100.0 /100 | #23 | Exceptional $65,079 |
| Immigrants | Northern Europe | 100.0 /100 | #24 | Exceptional $64,987 |
| Immigrants | Denmark | 100.0 /100 | #25 | Exceptional $64,625 |
| Turks | 100.0 /100 | #26 | Exceptional $64,253 |
| Immigrants | Switzerland | 100.0 /100 | #27 | Exceptional $63,944 |
| Russians | 100.0 /100 | #28 | Exceptional $63,939 |
| Asians | 100.0 /100 | #29 | Exceptional $63,827 |
| Immigrants | France | 100.0 /100 | #30 | Exceptional $63,715 |
| Latvians | 100.0 /100 | #31 | Exceptional $63,498 |
| Soviet Union | 100.0 /100 | #32 | Exceptional $63,382 |
| Immigrants | Lithuania | 100.0 /100 | #33 | Exceptional $63,346 |
| Immigrants | Russia | 100.0 /100 | #34 | Exceptional $63,326 |
Demographics Similar to Immigrants from Belize by Median Male Earnings
In terms of median male earnings, the demographic groups most similar to Immigrants from Belize are Chickasaw ($47,832, a difference of 0.050%), Choctaw ($47,729, a difference of 0.17%), Shoshone ($47,930, a difference of 0.25%), Immigrants from Dominica ($47,651, a difference of 0.33%), and Immigrants from El Salvador ($47,973, a difference of 0.34%).
| Demographics | Rating | Rank | Median Male Earnings |
| Immigrants | Jamaica | 0.2 /100 | #283 | Tragic $48,040 |
| Africans | 0.2 /100 | #284 | Tragic $47,994 |
| Paiute | 0.2 /100 | #285 | Tragic $47,991 |
| Mexican American Indians | 0.2 /100 | #286 | Tragic $47,990 |
| Immigrants | El Salvador | 0.2 /100 | #287 | Tragic $47,973 |
| Shoshone | 0.2 /100 | #288 | Tragic $47,930 |
| Chickasaw | 0.1 /100 | #289 | Tragic $47,832 |
| Immigrants | Belize | 0.1 /100 | #290 | Tragic $47,809 |
| Choctaw | 0.1 /100 | #291 | Tragic $47,729 |
| Immigrants | Dominica | 0.1 /100 | #292 | Tragic $47,651 |
| Indonesians | 0.1 /100 | #293 | Tragic $47,503 |
| Immigrants | Nicaragua | 0.1 /100 | #294 | Tragic $47,482 |
| Central American Indians | 0.1 /100 | #295 | Tragic $47,433 |
| Inupiat | 0.1 /100 | #296 | Tragic $47,281 |
| Dominicans | 0.1 /100 | #297 | Tragic $47,204 |