Immigrants from Middle Africa vs Chilean Married-Couple Family Poverty
COMPARE
Immigrants from Middle Africa
Chilean
Married-Couple Family Poverty
Married-Couple Family Poverty Comparison
Immigrants from Middle Africa
Chileans
5.4%
MARRIED-COUPLE FAMILY POVERTY
23.8/ 100
METRIC RATING
202nd/ 347
METRIC RANK
4.9%
MARRIED-COUPLE FAMILY POVERTY
86.0/ 100
METRIC RATING
138th/ 347
METRIC RANK
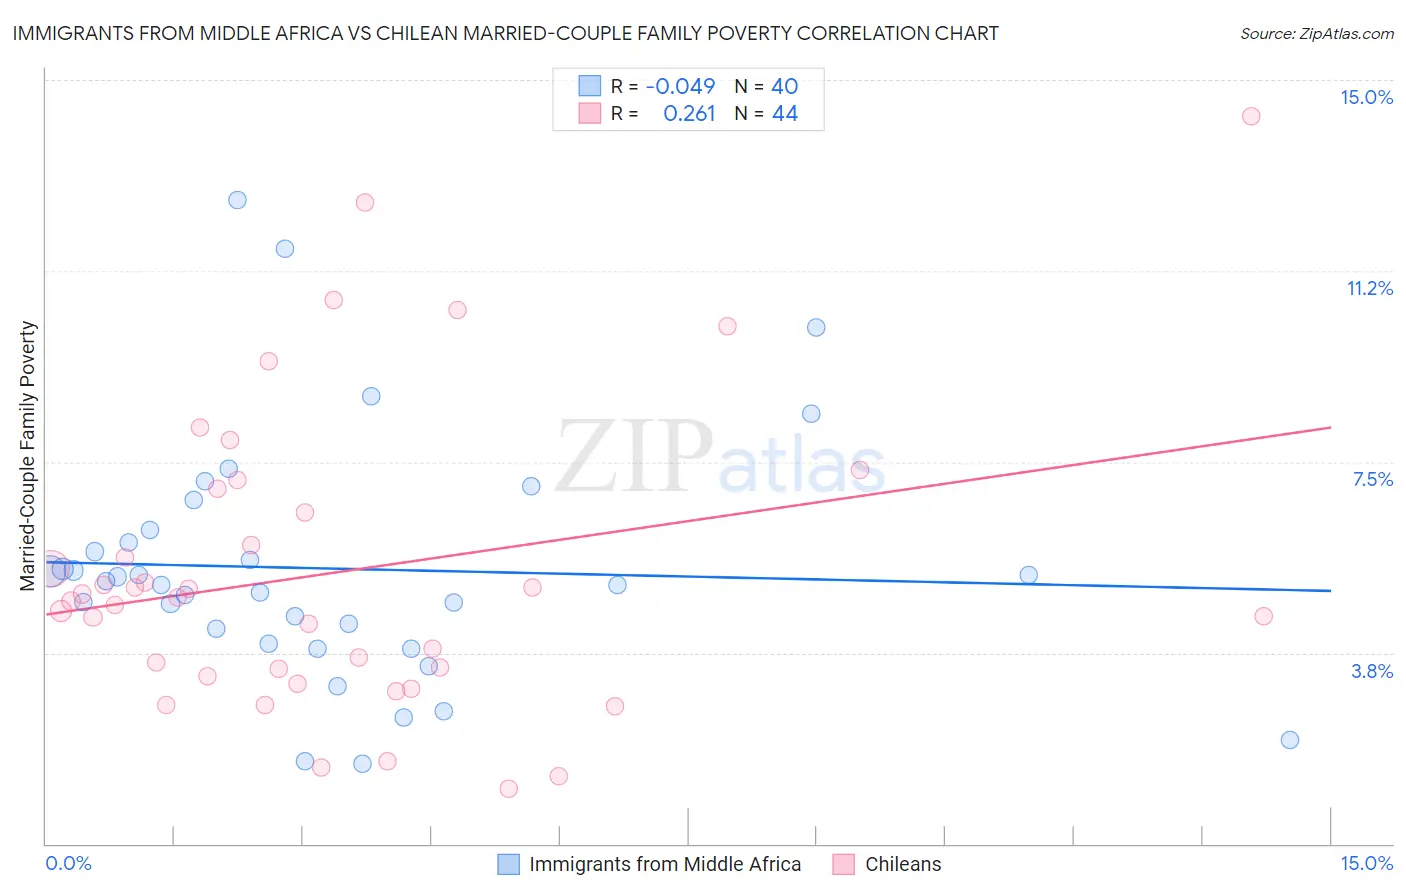
Immigrants from Middle Africa vs Chilean Married-Couple Family Poverty Correlation Chart
The statistical analysis conducted on geographies consisting of 201,849,753 people shows no correlation between the proportion of Immigrants from Middle Africa and poverty level among married-couple families in the United States with a correlation coefficient (R) of -0.049 and weighted average of 5.4%. Similarly, the statistical analysis conducted on geographies consisting of 255,436,750 people shows a weak positive correlation between the proportion of Chileans and poverty level among married-couple families in the United States with a correlation coefficient (R) of 0.261 and weighted average of 4.9%, a difference of 9.1%.
Married-Couple Family Poverty Correlation Summary
| Measurement | Immigrants from Middle Africa | Chilean |
| Minimum | 1.6% | 1.1% |
| Maximum | 12.6% | 14.3% |
| Range | 11.1% | 13.2% |
| Mean | 5.4% | 5.3% |
| Median | 5.1% | 4.8% |
| Interquartile 25% (IQ1) | 4.1% | 3.4% |
| Interquartile 75% (IQ3) | 6.0% | 6.7% |
| Interquartile Range (IQR) | 2.0% | 3.4% |
| Standard Deviation (Sample) | 2.4% | 3.0% |
| Standard Deviation (Population) | 2.4% | 2.9% |
Similar Demographics by Married-Couple Family Poverty
Demographics Similar to Immigrants from Middle Africa by Married-Couple Family Poverty
In terms of married-couple family poverty, the demographic groups most similar to Immigrants from Middle Africa are Lebanese (5.4%, a difference of 0.060%), Immigrants from Morocco (5.4%, a difference of 0.080%), Uruguayan (5.4%, a difference of 0.19%), Immigrants from Peru (5.4%, a difference of 0.32%), and Immigrants from Belarus (5.4%, a difference of 0.36%).
| Demographics | Rating | Rank | Married-Couple Family Poverty |
| Immigrants | Azores | 27.5 /100 | #195 | Fair 5.4% |
| Spaniards | 27.4 /100 | #196 | Fair 5.4% |
| Liberians | 26.3 /100 | #197 | Fair 5.4% |
| Immigrants | Belarus | 26.2 /100 | #198 | Fair 5.4% |
| Uruguayans | 25.0 /100 | #199 | Fair 5.4% |
| Immigrants | Morocco | 24.3 /100 | #200 | Fair 5.4% |
| Lebanese | 24.1 /100 | #201 | Fair 5.4% |
| Immigrants | Middle Africa | 23.8 /100 | #202 | Fair 5.4% |
| Immigrants | Peru | 21.8 /100 | #203 | Fair 5.4% |
| Immigrants | Costa Rica | 19.4 /100 | #204 | Poor 5.4% |
| Chippewa | 18.9 /100 | #205 | Poor 5.4% |
| Osage | 18.4 /100 | #206 | Poor 5.4% |
| Immigrants | Africa | 17.6 /100 | #207 | Poor 5.5% |
| French American Indians | 16.1 /100 | #208 | Poor 5.5% |
| Immigrants | Syria | 15.4 /100 | #209 | Poor 5.5% |
Demographics Similar to Chileans by Married-Couple Family Poverty
In terms of married-couple family poverty, the demographic groups most similar to Chileans are Guamanian/Chamorro (4.9%, a difference of 0.13%), German Russian (5.0%, a difference of 0.23%), Immigrants from Portugal (5.0%, a difference of 0.29%), Immigrants from Brazil (5.0%, a difference of 0.34%), and Immigrants from China (5.0%, a difference of 0.34%).
| Demographics | Rating | Rank | Married-Couple Family Poverty |
| Immigrants | Eastern Europe | 90.5 /100 | #131 | Exceptional 4.9% |
| Puget Sound Salish | 90.4 /100 | #132 | Exceptional 4.9% |
| Immigrants | Kenya | 90.2 /100 | #133 | Exceptional 4.9% |
| Samoans | 90.2 /100 | #134 | Exceptional 4.9% |
| Assyrians/Chaldeans/Syriacs | 89.4 /100 | #135 | Excellent 4.9% |
| Immigrants | Hungary | 88.7 /100 | #136 | Excellent 4.9% |
| Guamanians/Chamorros | 86.5 /100 | #137 | Excellent 4.9% |
| Chileans | 86.0 /100 | #138 | Excellent 4.9% |
| German Russians | 85.1 /100 | #139 | Excellent 5.0% |
| Immigrants | Portugal | 84.8 /100 | #140 | Excellent 5.0% |
| Immigrants | Brazil | 84.6 /100 | #141 | Excellent 5.0% |
| Immigrants | China | 84.6 /100 | #142 | Excellent 5.0% |
| Immigrants | Egypt | 83.4 /100 | #143 | Excellent 5.0% |
| Hmong | 83.2 /100 | #144 | Excellent 5.0% |
| Immigrants | Spain | 79.9 /100 | #145 | Good 5.0% |