Immigrants from Middle Africa vs Chilean 1 or more Vehicles in Household
COMPARE
Immigrants from Middle Africa
Chilean
1 or more Vehicles in Household
1 or more Vehicles in Household Comparison
Immigrants from Middle Africa
Chileans
89.9%
1 OR MORE VEHICLES IN HOUSEHOLD
62.2/ 100
METRIC RATING
166th/ 347
METRIC RANK
90.2%
1 OR MORE VEHICLES IN HOUSEHOLD
79.8/ 100
METRIC RATING
147th/ 347
METRIC RANK
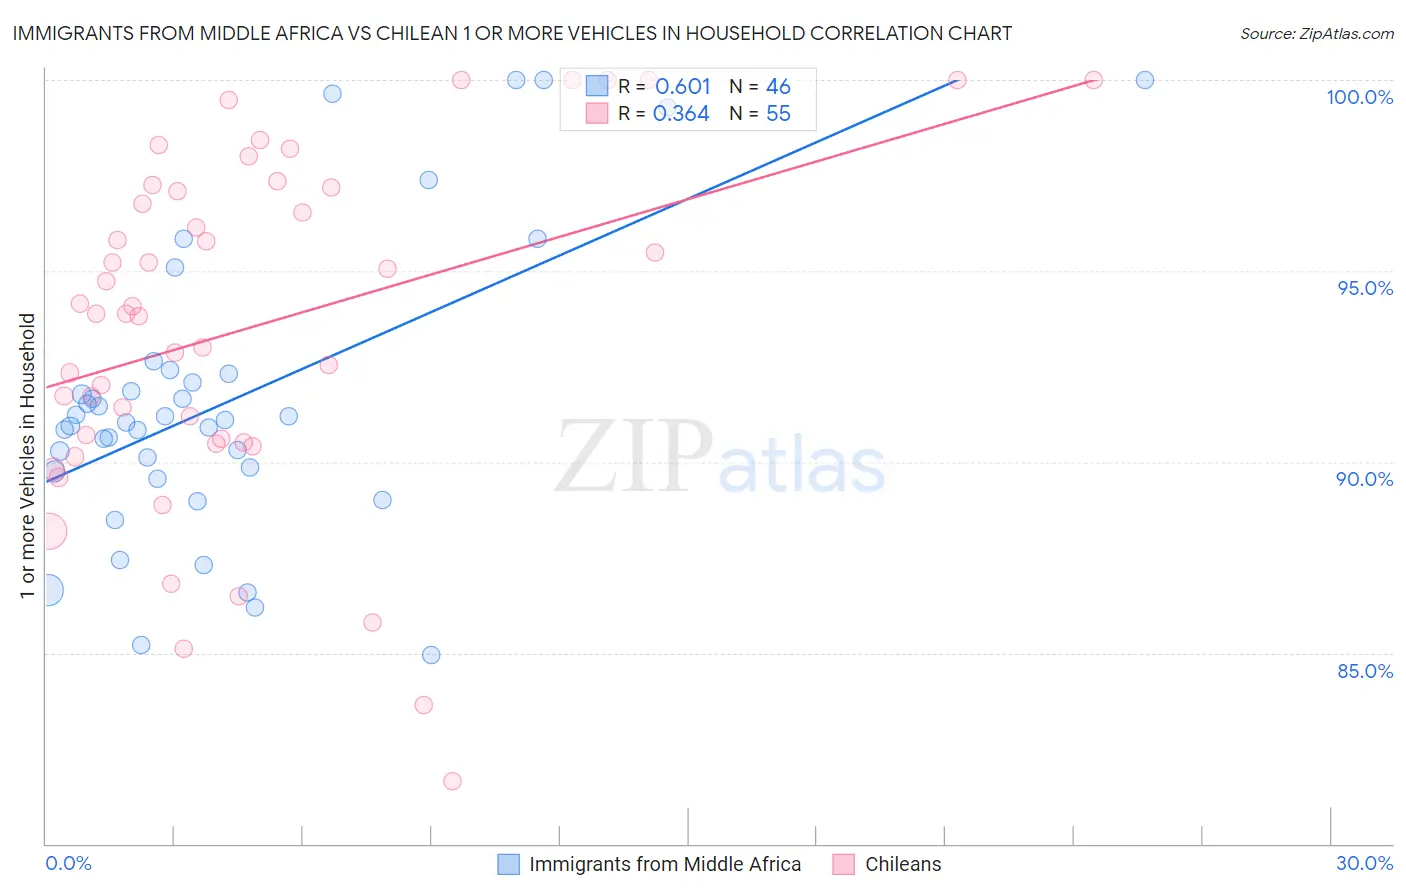
Immigrants from Middle Africa vs Chilean 1 or more Vehicles in Household Correlation Chart
The statistical analysis conducted on geographies consisting of 202,674,043 people shows a significant positive correlation between the proportion of Immigrants from Middle Africa and percentage of households with 1 or more vehicles available in the United States with a correlation coefficient (R) of 0.601 and weighted average of 89.9%. Similarly, the statistical analysis conducted on geographies consisting of 256,602,415 people shows a mild positive correlation between the proportion of Chileans and percentage of households with 1 or more vehicles available in the United States with a correlation coefficient (R) of 0.364 and weighted average of 90.2%, a difference of 0.34%.
1 or more Vehicles in Household Correlation Summary
| Measurement | Immigrants from Middle Africa | Chilean |
| Minimum | 85.0% | 81.6% |
| Maximum | 100.0% | 100.0% |
| Range | 15.0% | 18.4% |
| Mean | 91.6% | 93.6% |
| Median | 91.1% | 93.9% |
| Interquartile 25% (IQ1) | 89.7% | 90.5% |
| Interquartile 75% (IQ3) | 92.3% | 97.2% |
| Interquartile Range (IQR) | 2.5% | 6.7% |
| Standard Deviation (Sample) | 3.8% | 4.5% |
| Standard Deviation (Population) | 3.8% | 4.5% |
Demographics Similar to Immigrants from Middle Africa and Chileans by 1 or more Vehicles in Household
In terms of 1 or more vehicles in household, the demographic groups most similar to Immigrants from Middle Africa are Immigrants from Saudi Arabia (89.9%, a difference of 0.010%), Comanche (89.9%, a difference of 0.020%), Immigrants from Austria (89.9%, a difference of 0.060%), Spanish American Indian (89.9%, a difference of 0.080%), and Immigrants from Indonesia (90.0%, a difference of 0.11%). Similarly, the demographic groups most similar to Chileans are Bahamian (90.2%, a difference of 0.020%), Immigrants from Eastern Africa (90.1%, a difference of 0.040%), Immigrants from Nicaragua (90.1%, a difference of 0.070%), Immigrants from Micronesia (90.1%, a difference of 0.090%), and Immigrants from Bosnia and Herzegovina (90.1%, a difference of 0.10%).
| Demographics | Rating | Rank | 1 or more Vehicles in Household |
| Bahamians | 80.5 /100 | #146 | Excellent 90.2% |
| Chileans | 79.8 /100 | #147 | Good 90.2% |
| Immigrants | Eastern Africa | 78.2 /100 | #148 | Good 90.1% |
| Immigrants | Nicaragua | 76.7 /100 | #149 | Good 90.1% |
| Immigrants | Micronesia | 75.9 /100 | #150 | Good 90.1% |
| Immigrants | Bosnia and Herzegovina | 75.4 /100 | #151 | Good 90.1% |
| Tlingit-Haida | 74.3 /100 | #152 | Good 90.1% |
| New Zealanders | 73.8 /100 | #153 | Good 90.1% |
| Immigrants | Uganda | 73.8 /100 | #154 | Good 90.1% |
| Immigrants | Immigrants | 73.6 /100 | #155 | Good 90.1% |
| Australians | 72.4 /100 | #156 | Good 90.0% |
| Immigrants | Congo | 71.2 /100 | #157 | Good 90.0% |
| Brazilians | 71.0 /100 | #158 | Good 90.0% |
| South Africans | 69.7 /100 | #159 | Good 90.0% |
| Immigrants | Indonesia | 68.8 /100 | #160 | Good 90.0% |
| Salvadorans | 68.7 /100 | #161 | Good 90.0% |
| Spanish American Indians | 67.0 /100 | #162 | Good 89.9% |
| Immigrants | Austria | 65.5 /100 | #163 | Good 89.9% |
| Comanche | 63.4 /100 | #164 | Good 89.9% |
| Immigrants | Saudi Arabia | 62.6 /100 | #165 | Good 89.9% |
| Immigrants | Middle Africa | 62.2 /100 | #166 | Good 89.9% |