Immigrants from Middle Africa vs Israeli Married-Couple Family Poverty
COMPARE
Immigrants from Middle Africa
Israeli
Married-Couple Family Poverty
Married-Couple Family Poverty Comparison
Immigrants from Middle Africa
Israelis
5.4%
MARRIED-COUPLE FAMILY POVERTY
23.8/ 100
METRIC RATING
202nd/ 347
METRIC RANK
5.3%
MARRIED-COUPLE FAMILY POVERTY
33.1/ 100
METRIC RATING
188th/ 347
METRIC RANK
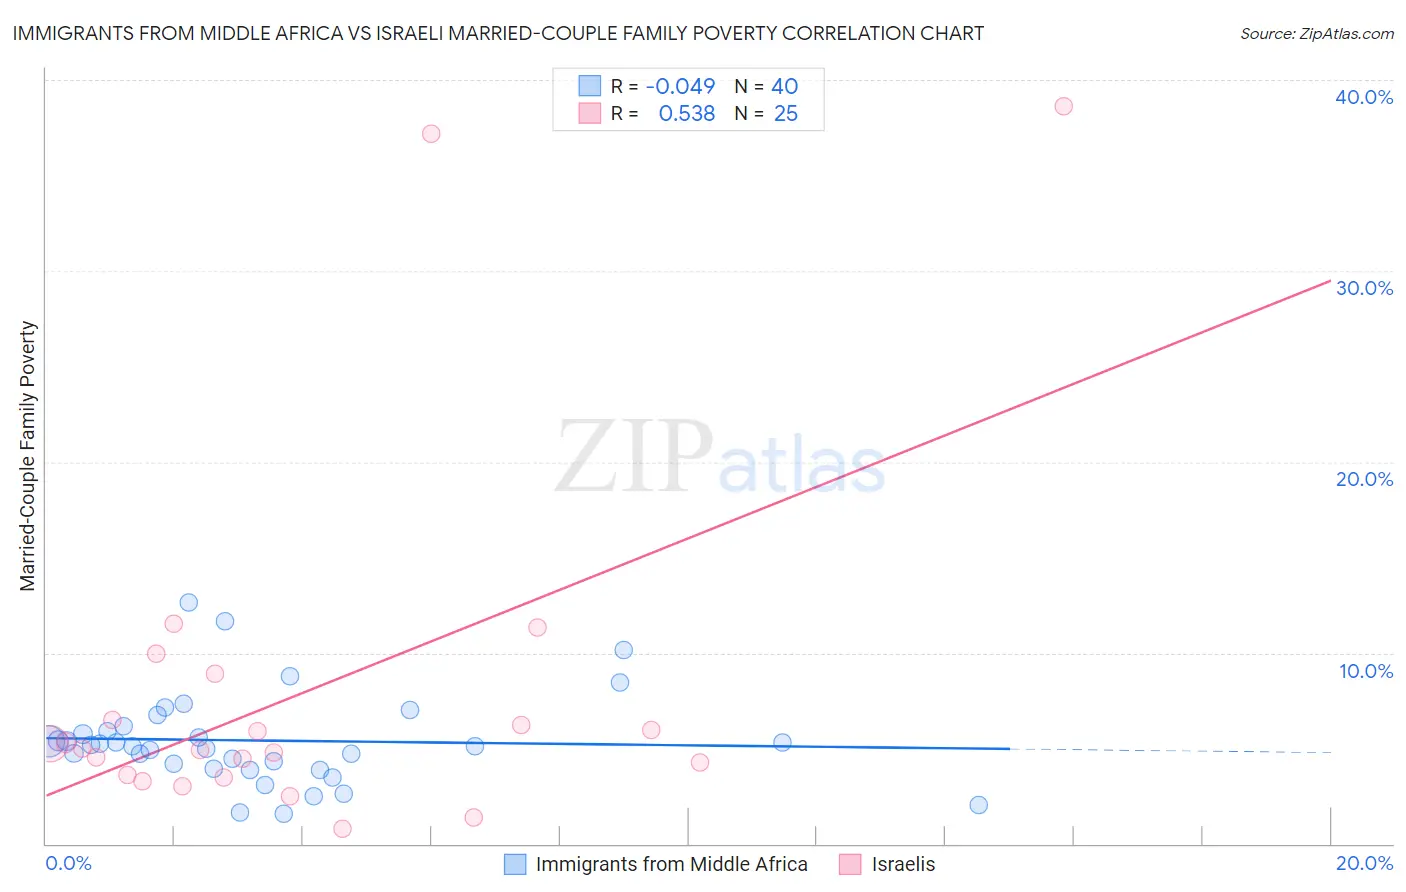
Immigrants from Middle Africa vs Israeli Married-Couple Family Poverty Correlation Chart
The statistical analysis conducted on geographies consisting of 201,849,753 people shows no correlation between the proportion of Immigrants from Middle Africa and poverty level among married-couple families in the United States with a correlation coefficient (R) of -0.049 and weighted average of 5.4%. Similarly, the statistical analysis conducted on geographies consisting of 209,909,824 people shows a substantial positive correlation between the proportion of Israelis and poverty level among married-couple families in the United States with a correlation coefficient (R) of 0.538 and weighted average of 5.3%, a difference of 1.3%.
Married-Couple Family Poverty Correlation Summary
| Measurement | Immigrants from Middle Africa | Israeli |
| Minimum | 1.6% | 0.81% |
| Maximum | 12.6% | 38.6% |
| Range | 11.1% | 37.8% |
| Mean | 5.4% | 7.9% |
| Median | 5.1% | 5.0% |
| Interquartile 25% (IQ1) | 4.1% | 3.5% |
| Interquartile 75% (IQ3) | 6.0% | 7.7% |
| Interquartile Range (IQR) | 2.0% | 4.1% |
| Standard Deviation (Sample) | 2.4% | 9.4% |
| Standard Deviation (Population) | 2.4% | 9.2% |
Demographics Similar to Immigrants from Middle Africa and Israelis by Married-Couple Family Poverty
In terms of married-couple family poverty, the demographic groups most similar to Immigrants from Middle Africa are Lebanese (5.4%, a difference of 0.060%), Immigrants from Morocco (5.4%, a difference of 0.080%), Uruguayan (5.4%, a difference of 0.19%), Immigrants from Peru (5.4%, a difference of 0.32%), and Immigrants from Belarus (5.4%, a difference of 0.36%). Similarly, the demographic groups most similar to Israelis are Immigrants from Albania (5.3%, a difference of 0.090%), South American Indian (5.3%, a difference of 0.090%), Hungarian (5.3%, a difference of 0.20%), Ugandan (5.3%, a difference of 0.20%), and American (5.3%, a difference of 0.28%).
| Demographics | Rating | Rank | Married-Couple Family Poverty |
| Americans | 35.4 /100 | #185 | Fair 5.3% |
| Hungarians | 34.7 /100 | #186 | Fair 5.3% |
| Immigrants | Albania | 33.8 /100 | #187 | Fair 5.3% |
| Israelis | 33.1 /100 | #188 | Fair 5.3% |
| South American Indians | 32.5 /100 | #189 | Fair 5.3% |
| Ugandans | 31.6 /100 | #190 | Fair 5.3% |
| Immigrants | Cabo Verde | 30.9 /100 | #191 | Fair 5.3% |
| Cape Verdeans | 30.7 /100 | #192 | Fair 5.3% |
| Malaysians | 29.5 /100 | #193 | Fair 5.4% |
| Immigrants | Israel | 27.8 /100 | #194 | Fair 5.4% |
| Immigrants | Azores | 27.5 /100 | #195 | Fair 5.4% |
| Spaniards | 27.4 /100 | #196 | Fair 5.4% |
| Liberians | 26.3 /100 | #197 | Fair 5.4% |
| Immigrants | Belarus | 26.2 /100 | #198 | Fair 5.4% |
| Uruguayans | 25.0 /100 | #199 | Fair 5.4% |
| Immigrants | Morocco | 24.3 /100 | #200 | Fair 5.4% |
| Lebanese | 24.1 /100 | #201 | Fair 5.4% |
| Immigrants | Middle Africa | 23.8 /100 | #202 | Fair 5.4% |
| Immigrants | Peru | 21.8 /100 | #203 | Fair 5.4% |
| Immigrants | Costa Rica | 19.4 /100 | #204 | Poor 5.4% |
| Chippewa | 18.9 /100 | #205 | Poor 5.4% |