Immigrants from Middle Africa vs British West Indian Married-Couple Family Poverty
COMPARE
Immigrants from Middle Africa
British West Indian
Married-Couple Family Poverty
Married-Couple Family Poverty Comparison
Immigrants from Middle Africa
British West Indians
5.4%
MARRIED-COUPLE FAMILY POVERTY
23.8/ 100
METRIC RATING
202nd/ 347
METRIC RANK
7.1%
MARRIED-COUPLE FAMILY POVERTY
0.0/ 100
METRIC RATING
314th/ 347
METRIC RANK
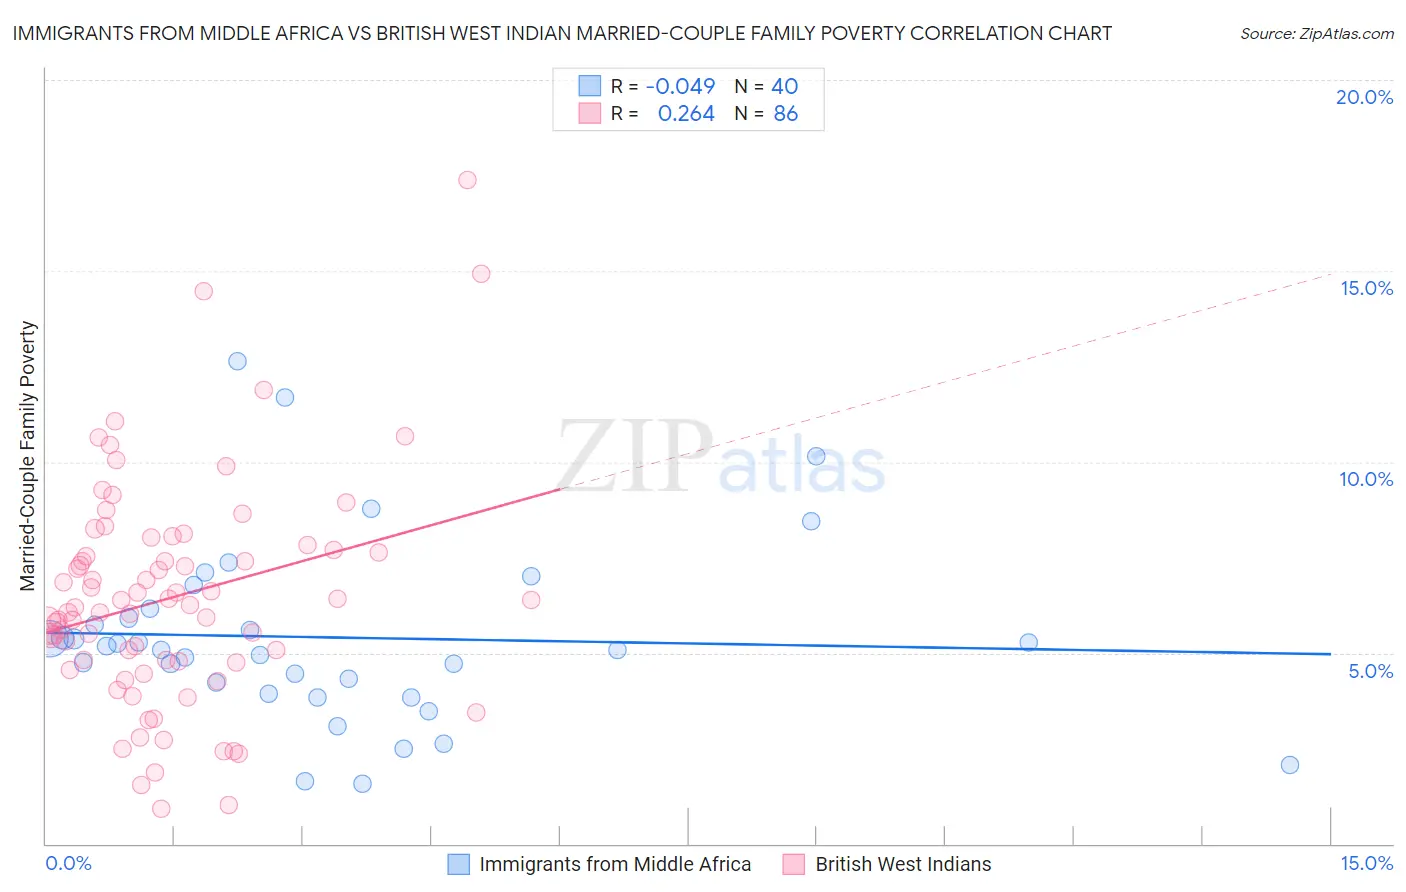
Immigrants from Middle Africa vs British West Indian Married-Couple Family Poverty Correlation Chart
The statistical analysis conducted on geographies consisting of 201,849,753 people shows no correlation between the proportion of Immigrants from Middle Africa and poverty level among married-couple families in the United States with a correlation coefficient (R) of -0.049 and weighted average of 5.4%. Similarly, the statistical analysis conducted on geographies consisting of 152,203,560 people shows a weak positive correlation between the proportion of British West Indians and poverty level among married-couple families in the United States with a correlation coefficient (R) of 0.264 and weighted average of 7.1%, a difference of 32.1%.
Married-Couple Family Poverty Correlation Summary
| Measurement | Immigrants from Middle Africa | British West Indian |
| Minimum | 1.6% | 0.91% |
| Maximum | 12.6% | 17.4% |
| Range | 11.1% | 16.5% |
| Mean | 5.4% | 6.4% |
| Median | 5.1% | 6.2% |
| Interquartile 25% (IQ1) | 4.1% | 4.8% |
| Interquartile 75% (IQ3) | 6.0% | 7.7% |
| Interquartile Range (IQR) | 2.0% | 2.9% |
| Standard Deviation (Sample) | 2.4% | 2.9% |
| Standard Deviation (Population) | 2.4% | 2.9% |
Similar Demographics by Married-Couple Family Poverty
Demographics Similar to Immigrants from Middle Africa by Married-Couple Family Poverty
In terms of married-couple family poverty, the demographic groups most similar to Immigrants from Middle Africa are Lebanese (5.4%, a difference of 0.060%), Immigrants from Morocco (5.4%, a difference of 0.080%), Uruguayan (5.4%, a difference of 0.19%), Immigrants from Peru (5.4%, a difference of 0.32%), and Immigrants from Belarus (5.4%, a difference of 0.36%).
| Demographics | Rating | Rank | Married-Couple Family Poverty |
| Immigrants | Azores | 27.5 /100 | #195 | Fair 5.4% |
| Spaniards | 27.4 /100 | #196 | Fair 5.4% |
| Liberians | 26.3 /100 | #197 | Fair 5.4% |
| Immigrants | Belarus | 26.2 /100 | #198 | Fair 5.4% |
| Uruguayans | 25.0 /100 | #199 | Fair 5.4% |
| Immigrants | Morocco | 24.3 /100 | #200 | Fair 5.4% |
| Lebanese | 24.1 /100 | #201 | Fair 5.4% |
| Immigrants | Middle Africa | 23.8 /100 | #202 | Fair 5.4% |
| Immigrants | Peru | 21.8 /100 | #203 | Fair 5.4% |
| Immigrants | Costa Rica | 19.4 /100 | #204 | Poor 5.4% |
| Chippewa | 18.9 /100 | #205 | Poor 5.4% |
| Osage | 18.4 /100 | #206 | Poor 5.4% |
| Immigrants | Africa | 17.6 /100 | #207 | Poor 5.5% |
| French American Indians | 16.1 /100 | #208 | Poor 5.5% |
| Immigrants | Syria | 15.4 /100 | #209 | Poor 5.5% |
Demographics Similar to British West Indians by Married-Couple Family Poverty
In terms of married-couple family poverty, the demographic groups most similar to British West Indians are Inupiat (7.1%, a difference of 0.24%), Immigrants from St. Vincent and the Grenadines (7.1%, a difference of 0.30%), Honduran (7.2%, a difference of 0.39%), Immigrants from Dominica (7.1%, a difference of 0.41%), and Immigrants from Armenia (7.1%, a difference of 0.41%).
| Demographics | Rating | Rank | Married-Couple Family Poverty |
| Guatemalans | 0.0 /100 | #307 | Tragic 7.0% |
| Spanish American Indians | 0.0 /100 | #308 | Tragic 7.1% |
| Hopi | 0.0 /100 | #309 | Tragic 7.1% |
| Immigrants | Nicaragua | 0.0 /100 | #310 | Tragic 7.1% |
| Immigrants | Dominica | 0.0 /100 | #311 | Tragic 7.1% |
| Immigrants | Armenia | 0.0 /100 | #312 | Tragic 7.1% |
| Immigrants | St. Vincent and the Grenadines | 0.0 /100 | #313 | Tragic 7.1% |
| British West Indians | 0.0 /100 | #314 | Tragic 7.1% |
| Inupiat | 0.0 /100 | #315 | Tragic 7.1% |
| Hondurans | 0.0 /100 | #316 | Tragic 7.2% |
| Mexicans | 0.0 /100 | #317 | Tragic 7.2% |
| Immigrants | Guatemala | 0.0 /100 | #318 | Tragic 7.2% |
| Immigrants | Latin America | 0.0 /100 | #319 | Tragic 7.2% |
| Immigrants | Grenada | 0.0 /100 | #320 | Tragic 7.3% |
| Immigrants | Caribbean | 0.0 /100 | #321 | Tragic 7.3% |