Immigrants from Micronesia vs Lithuanian Child Poverty Under the Age of 5
COMPARE
Immigrants from Micronesia
Lithuanian
Child Poverty Under the Age of 5
Child Poverty Under the Age of 5 Comparison
Immigrants from Micronesia
Lithuanians
19.4%
CHILD POVERTY UNDER THE AGE OF 5
0.9/ 100
METRIC RATING
234th/ 347
METRIC RANK
15.2%
CHILD POVERTY UNDER THE AGE OF 5
99.0/ 100
METRIC RATING
69th/ 347
METRIC RANK
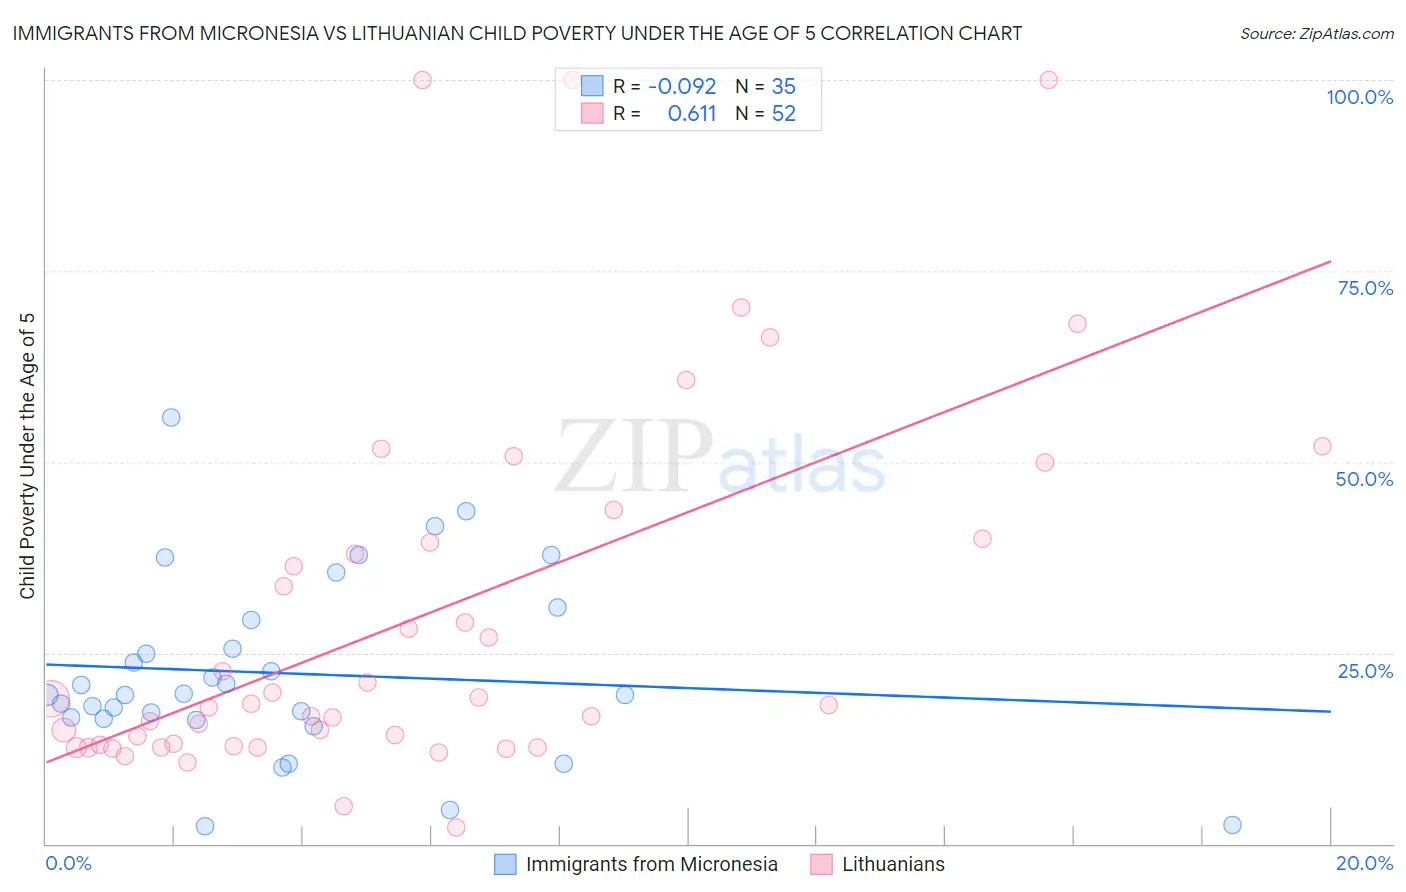
Immigrants from Micronesia vs Lithuanian Child Poverty Under the Age of 5 Correlation Chart
The statistical analysis conducted on geographies consisting of 61,294,346 people shows a slight negative correlation between the proportion of Immigrants from Micronesia and poverty level among children under the age of 5 in the United States with a correlation coefficient (R) of -0.092 and weighted average of 19.4%. Similarly, the statistical analysis conducted on geographies consisting of 398,178,552 people shows a significant positive correlation between the proportion of Lithuanians and poverty level among children under the age of 5 in the United States with a correlation coefficient (R) of 0.611 and weighted average of 15.2%, a difference of 27.5%.
Child Poverty Under the Age of 5 Correlation Summary
| Measurement | Immigrants from Micronesia | Lithuanian |
| Minimum | 2.3% | 2.2% |
| Maximum | 55.8% | 100.0% |
| Range | 53.5% | 97.8% |
| Mean | 22.3% | 29.8% |
| Median | 19.5% | 18.3% |
| Interquartile 25% (IQ1) | 16.4% | 12.9% |
| Interquartile 75% (IQ3) | 29.4% | 39.7% |
| Interquartile Range (IQR) | 12.9% | 26.9% |
| Standard Deviation (Sample) | 11.9% | 24.5% |
| Standard Deviation (Population) | 11.7% | 24.2% |
Similar Demographics by Child Poverty Under the Age of 5
Demographics Similar to Immigrants from Micronesia by Child Poverty Under the Age of 5
In terms of child poverty under the age of 5, the demographic groups most similar to Immigrants from Micronesia are Sudanese (19.3%, a difference of 0.12%), Trinidadian and Tobagonian (19.3%, a difference of 0.18%), Immigrants from Laos (19.4%, a difference of 0.21%), Immigrants from Trinidad and Tobago (19.4%, a difference of 0.21%), and Bermudan (19.2%, a difference of 0.74%).
| Demographics | Rating | Rank | Child Poverty Under the Age of 5 |
| Cape Verdeans | 1.4 /100 | #227 | Tragic 19.1% |
| Immigrants | Sudan | 1.3 /100 | #228 | Tragic 19.2% |
| Ghanaians | 1.2 /100 | #229 | Tragic 19.2% |
| Ecuadorians | 1.2 /100 | #230 | Tragic 19.2% |
| Bermudans | 1.2 /100 | #231 | Tragic 19.2% |
| Trinidadians and Tobagonians | 0.9 /100 | #232 | Tragic 19.3% |
| Sudanese | 0.9 /100 | #233 | Tragic 19.3% |
| Immigrants | Micronesia | 0.9 /100 | #234 | Tragic 19.4% |
| Immigrants | Laos | 0.8 /100 | #235 | Tragic 19.4% |
| Immigrants | Trinidad and Tobago | 0.8 /100 | #236 | Tragic 19.4% |
| Immigrants | Cabo Verde | 0.6 /100 | #237 | Tragic 19.5% |
| Salvadorans | 0.6 /100 | #238 | Tragic 19.5% |
| Vietnamese | 0.6 /100 | #239 | Tragic 19.5% |
| Immigrants | Ecuador | 0.5 /100 | #240 | Tragic 19.6% |
| Alaska Natives | 0.5 /100 | #241 | Tragic 19.6% |
Demographics Similar to Lithuanians by Child Poverty Under the Age of 5
In terms of child poverty under the age of 5, the demographic groups most similar to Lithuanians are Zimbabwean (15.2%, a difference of 0.010%), Greek (15.2%, a difference of 0.020%), Immigrants from Scotland (15.2%, a difference of 0.080%), Immigrants from Fiji (15.2%, a difference of 0.19%), and Immigrants from Romania (15.2%, a difference of 0.22%).
| Demographics | Rating | Rank | Child Poverty Under the Age of 5 |
| Immigrants | Eastern Europe | 99.1 /100 | #62 | Exceptional 15.1% |
| Immigrants | Europe | 99.1 /100 | #63 | Exceptional 15.1% |
| Immigrants | Romania | 99.1 /100 | #64 | Exceptional 15.2% |
| Immigrants | Fiji | 99.0 /100 | #65 | Exceptional 15.2% |
| Immigrants | Scotland | 99.0 /100 | #66 | Exceptional 15.2% |
| Greeks | 99.0 /100 | #67 | Exceptional 15.2% |
| Zimbabweans | 99.0 /100 | #68 | Exceptional 15.2% |
| Lithuanians | 99.0 /100 | #69 | Exceptional 15.2% |
| Immigrants | Belgium | 98.8 /100 | #70 | Exceptional 15.3% |
| Immigrants | Egypt | 98.8 /100 | #71 | Exceptional 15.3% |
| Immigrants | Sweden | 98.8 /100 | #72 | Exceptional 15.3% |
| Immigrants | Ukraine | 98.7 /100 | #73 | Exceptional 15.3% |
| Argentineans | 98.5 /100 | #74 | Exceptional 15.4% |
| Immigrants | Argentina | 98.5 /100 | #75 | Exceptional 15.4% |
| Croatians | 98.5 /100 | #76 | Exceptional 15.4% |