Immigrants from Micronesia vs Lithuanian 6th Grade
COMPARE
Immigrants from Micronesia
Lithuanian
6th Grade
6th Grade Comparison
Immigrants from Micronesia
Lithuanians
97.0%
6TH GRADE
47.1/ 100
METRIC RATING
176th/ 347
METRIC RANK
98.1%
6TH GRADE
100.0/ 100
METRIC RATING
21st/ 347
METRIC RANK
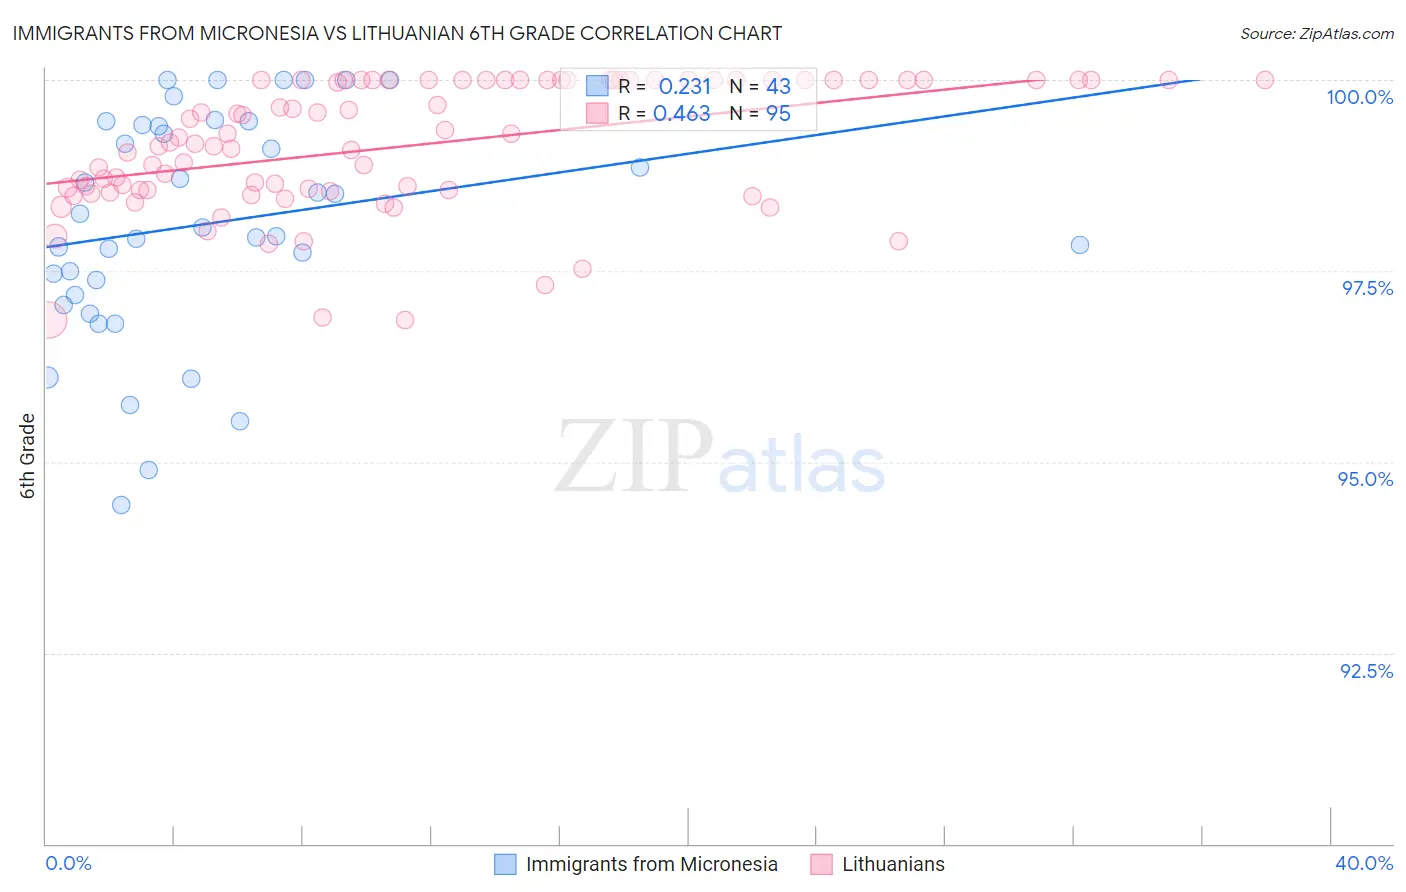
Immigrants from Micronesia vs Lithuanian 6th Grade Correlation Chart
The statistical analysis conducted on geographies consisting of 61,604,657 people shows a weak positive correlation between the proportion of Immigrants from Micronesia and percentage of population with at least 6th grade education in the United States with a correlation coefficient (R) of 0.231 and weighted average of 97.0%. Similarly, the statistical analysis conducted on geographies consisting of 421,945,620 people shows a moderate positive correlation between the proportion of Lithuanians and percentage of population with at least 6th grade education in the United States with a correlation coefficient (R) of 0.463 and weighted average of 98.1%, a difference of 1.1%.
6th Grade Correlation Summary
| Measurement | Immigrants from Micronesia | Lithuanian |
| Minimum | 94.4% | 96.9% |
| Maximum | 100.0% | 100.0% |
| Range | 5.6% | 3.1% |
| Mean | 98.1% | 99.1% |
| Median | 98.1% | 99.2% |
| Interquartile 25% (IQ1) | 97.2% | 98.6% |
| Interquartile 75% (IQ3) | 99.4% | 100.0% |
| Interquartile Range (IQR) | 2.2% | 1.4% |
| Standard Deviation (Sample) | 1.5% | 0.84% |
| Standard Deviation (Population) | 1.5% | 0.84% |
Similar Demographics by 6th Grade
Demographics Similar to Immigrants from Micronesia by 6th Grade
In terms of 6th grade, the demographic groups most similar to Immigrants from Micronesia are Immigrants from Kazakhstan (97.0%, a difference of 0.0%), Mongolian (97.0%, a difference of 0.0%), Arab (97.0%, a difference of 0.010%), Venezuelan (97.0%, a difference of 0.010%), and Pakistani (97.0%, a difference of 0.010%).
| Demographics | Rating | Rank | 6th Grade |
| Bermudans | 52.6 /100 | #169 | Average 97.1% |
| Chileans | 52.1 /100 | #170 | Average 97.1% |
| Immigrants | Sri Lanka | 51.7 /100 | #171 | Average 97.1% |
| Egyptians | 50.9 /100 | #172 | Average 97.1% |
| Arabs | 50.1 /100 | #173 | Average 97.0% |
| Venezuelans | 50.0 /100 | #174 | Average 97.0% |
| Immigrants | Kazakhstan | 47.3 /100 | #175 | Average 97.0% |
| Immigrants | Micronesia | 47.1 /100 | #176 | Average 97.0% |
| Mongolians | 46.7 /100 | #177 | Average 97.0% |
| Pakistanis | 46.0 /100 | #178 | Average 97.0% |
| Immigrants | Kenya | 45.3 /100 | #179 | Average 97.0% |
| Immigrants | Spain | 39.9 /100 | #180 | Fair 97.0% |
| Comanche | 37.9 /100 | #181 | Fair 97.0% |
| Immigrants | Ukraine | 35.6 /100 | #182 | Fair 97.0% |
| Immigrants | Venezuela | 34.5 /100 | #183 | Fair 97.0% |
Demographics Similar to Lithuanians by 6th Grade
In terms of 6th grade, the demographic groups most similar to Lithuanians are Finnish (98.1%, a difference of 0.010%), Danish (98.0%, a difference of 0.020%), Polish (98.1%, a difference of 0.030%), Pennsylvania German (98.1%, a difference of 0.030%), and Irish (98.1%, a difference of 0.030%).
| Demographics | Rating | Rank | 6th Grade |
| Carpatho Rusyns | 100.0 /100 | #14 | Exceptional 98.1% |
| Inupiat | 100.0 /100 | #15 | Exceptional 98.1% |
| Scottish | 100.0 /100 | #16 | Exceptional 98.1% |
| Poles | 100.0 /100 | #17 | Exceptional 98.1% |
| Pennsylvania Germans | 100.0 /100 | #18 | Exceptional 98.1% |
| Irish | 100.0 /100 | #19 | Exceptional 98.1% |
| Finns | 100.0 /100 | #20 | Exceptional 98.1% |
| Lithuanians | 100.0 /100 | #21 | Exceptional 98.1% |
| Danes | 100.0 /100 | #22 | Exceptional 98.0% |
| Sioux | 100.0 /100 | #23 | Exceptional 98.0% |
| Croatians | 100.0 /100 | #24 | Exceptional 98.0% |
| Scotch-Irish | 100.0 /100 | #25 | Exceptional 98.0% |
| Czechs | 100.0 /100 | #26 | Exceptional 98.0% |
| Yup'ik | 100.0 /100 | #27 | Exceptional 98.0% |
| Scandinavians | 100.0 /100 | #28 | Exceptional 98.0% |