South American Indian vs Cuban Married-Couple Family Poverty
COMPARE
South American Indian
Cuban
Married-Couple Family Poverty
Married-Couple Family Poverty Comparison
South American Indians
Cubans
5.3%
MARRIED-COUPLE FAMILY POVERTY
32.5/ 100
METRIC RATING
189th/ 347
METRIC RANK
6.8%
MARRIED-COUPLE FAMILY POVERTY
0.0/ 100
METRIC RATING
304th/ 347
METRIC RANK
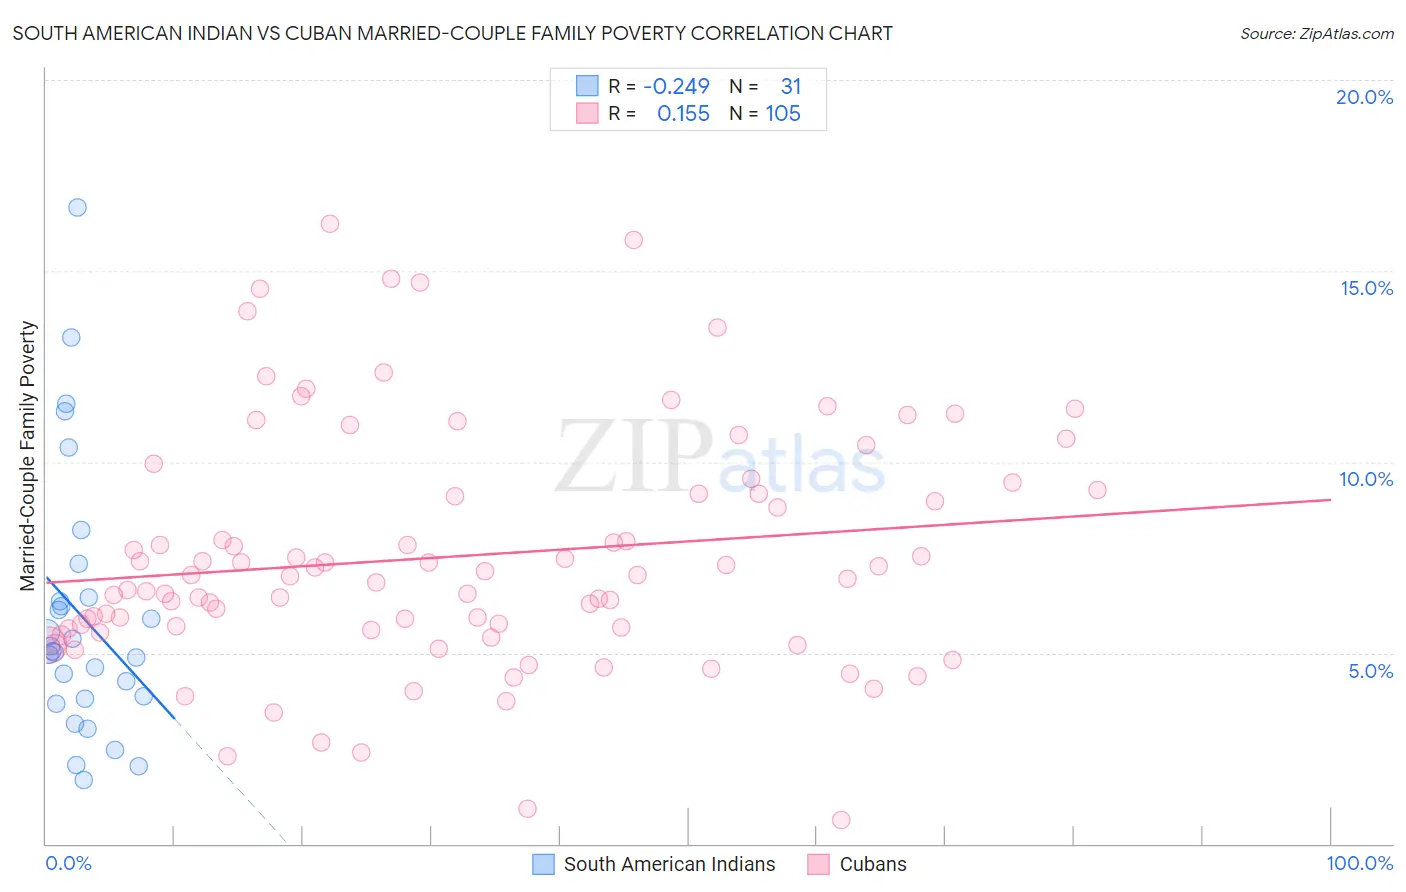
South American Indian vs Cuban Married-Couple Family Poverty Correlation Chart
The statistical analysis conducted on geographies consisting of 164,101,002 people shows a weak negative correlation between the proportion of South American Indians and poverty level among married-couple families in the United States with a correlation coefficient (R) of -0.249 and weighted average of 5.3%. Similarly, the statistical analysis conducted on geographies consisting of 444,866,425 people shows a poor positive correlation between the proportion of Cubans and poverty level among married-couple families in the United States with a correlation coefficient (R) of 0.155 and weighted average of 6.8%, a difference of 27.5%.
Married-Couple Family Poverty Correlation Summary
| Measurement | South American Indian | Cuban |
| Minimum | 1.7% | 0.61% |
| Maximum | 16.7% | 16.2% |
| Range | 15.0% | 15.6% |
| Mean | 6.0% | 7.5% |
| Median | 5.0% | 7.0% |
| Interquartile 25% (IQ1) | 3.8% | 5.6% |
| Interquartile 75% (IQ3) | 6.5% | 9.2% |
| Interquartile Range (IQR) | 2.7% | 3.6% |
| Standard Deviation (Sample) | 3.5% | 3.1% |
| Standard Deviation (Population) | 3.4% | 3.1% |
Similar Demographics by Married-Couple Family Poverty
Demographics Similar to South American Indians by Married-Couple Family Poverty
In terms of married-couple family poverty, the demographic groups most similar to South American Indians are Israeli (5.3%, a difference of 0.090%), Ugandan (5.3%, a difference of 0.11%), Immigrants from Albania (5.3%, a difference of 0.18%), Immigrants from Cabo Verde (5.3%, a difference of 0.20%), and Cape Verdean (5.3%, a difference of 0.23%).
| Demographics | Rating | Rank | Married-Couple Family Poverty |
| Immigrants | Vietnam | 37.7 /100 | #182 | Fair 5.3% |
| Peruvians | 37.6 /100 | #183 | Fair 5.3% |
| Immigrants | Nonimmigrants | 35.8 /100 | #184 | Fair 5.3% |
| Americans | 35.4 /100 | #185 | Fair 5.3% |
| Hungarians | 34.7 /100 | #186 | Fair 5.3% |
| Immigrants | Albania | 33.8 /100 | #187 | Fair 5.3% |
| Israelis | 33.1 /100 | #188 | Fair 5.3% |
| South American Indians | 32.5 /100 | #189 | Fair 5.3% |
| Ugandans | 31.6 /100 | #190 | Fair 5.3% |
| Immigrants | Cabo Verde | 30.9 /100 | #191 | Fair 5.3% |
| Cape Verdeans | 30.7 /100 | #192 | Fair 5.3% |
| Malaysians | 29.5 /100 | #193 | Fair 5.4% |
| Immigrants | Israel | 27.8 /100 | #194 | Fair 5.4% |
| Immigrants | Azores | 27.5 /100 | #195 | Fair 5.4% |
| Spaniards | 27.4 /100 | #196 | Fair 5.4% |
Demographics Similar to Cubans by Married-Couple Family Poverty
In terms of married-couple family poverty, the demographic groups most similar to Cubans are Haitian (6.8%, a difference of 0.10%), Immigrants from El Salvador (6.8%, a difference of 0.44%), Immigrants from Ecuador (6.7%, a difference of 0.72%), Central American (6.7%, a difference of 0.86%), and Immigrants from Belize (6.7%, a difference of 1.5%).
| Demographics | Rating | Rank | Married-Couple Family Poverty |
| Kiowa | 0.0 /100 | #297 | Tragic 6.6% |
| Immigrants | Guyana | 0.0 /100 | #298 | Tragic 6.7% |
| Nicaraguans | 0.0 /100 | #299 | Tragic 6.7% |
| Immigrants | Belize | 0.0 /100 | #300 | Tragic 6.7% |
| Central Americans | 0.0 /100 | #301 | Tragic 6.7% |
| Immigrants | Ecuador | 0.0 /100 | #302 | Tragic 6.7% |
| Immigrants | El Salvador | 0.0 /100 | #303 | Tragic 6.8% |
| Cubans | 0.0 /100 | #304 | Tragic 6.8% |
| Haitians | 0.0 /100 | #305 | Tragic 6.8% |
| Immigrants | Haiti | 0.0 /100 | #306 | Tragic 7.0% |
| Guatemalans | 0.0 /100 | #307 | Tragic 7.0% |
| Spanish American Indians | 0.0 /100 | #308 | Tragic 7.1% |
| Hopi | 0.0 /100 | #309 | Tragic 7.1% |
| Immigrants | Nicaragua | 0.0 /100 | #310 | Tragic 7.1% |
| Immigrants | Dominica | 0.0 /100 | #311 | Tragic 7.1% |