Immigrants from Eritrea vs Houma Ambulatory Disability
COMPARE
Immigrants from Eritrea
Houma
Ambulatory Disability
Ambulatory Disability Comparison
Immigrants from Eritrea
Houma
5.5%
AMBULATORY DISABILITY
100.0/ 100
METRIC RATING
39th/ 347
METRIC RANK
9.3%
AMBULATORY DISABILITY
0.0/ 100
METRIC RATING
346th/ 347
METRIC RANK
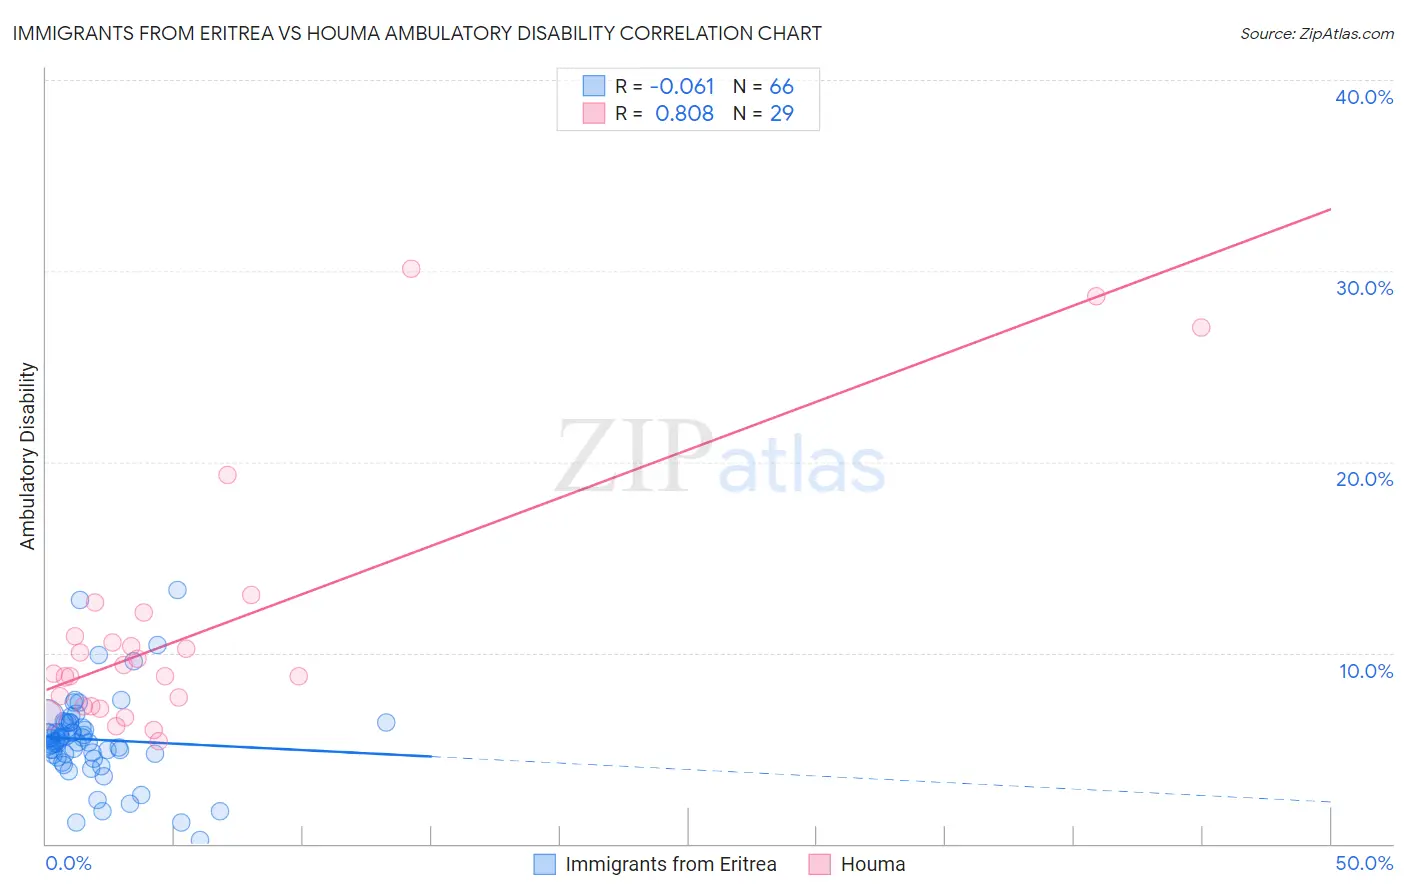
Immigrants from Eritrea vs Houma Ambulatory Disability Correlation Chart
The statistical analysis conducted on geographies consisting of 104,852,788 people shows a slight negative correlation between the proportion of Immigrants from Eritrea and percentage of population with ambulatory disability in the United States with a correlation coefficient (R) of -0.061 and weighted average of 5.5%. Similarly, the statistical analysis conducted on geographies consisting of 36,798,241 people shows a very strong positive correlation between the proportion of Houma and percentage of population with ambulatory disability in the United States with a correlation coefficient (R) of 0.808 and weighted average of 9.3%, a difference of 69.7%.
Ambulatory Disability Correlation Summary
| Measurement | Immigrants from Eritrea | Houma |
| Minimum | 0.17% | 5.4% |
| Maximum | 13.3% | 30.1% |
| Range | 13.1% | 24.8% |
| Mean | 5.5% | 11.2% |
| Median | 5.4% | 8.9% |
| Interquartile 25% (IQ1) | 4.7% | 7.2% |
| Interquartile 75% (IQ3) | 6.3% | 11.5% |
| Interquartile Range (IQR) | 1.6% | 4.3% |
| Standard Deviation (Sample) | 2.3% | 6.6% |
| Standard Deviation (Population) | 2.3% | 6.5% |
Similar Demographics by Ambulatory Disability
Demographics Similar to Immigrants from Eritrea by Ambulatory Disability
In terms of ambulatory disability, the demographic groups most similar to Immigrants from Eritrea are Turkish (5.5%, a difference of 0.090%), Cypriot (5.5%, a difference of 0.090%), Immigrants from Malaysia (5.5%, a difference of 0.11%), Afghan (5.5%, a difference of 0.18%), and Immigrants from Asia (5.5%, a difference of 0.22%).
| Demographics | Rating | Rank | Ambulatory Disability |
| Immigrants | Australia | 100.0 /100 | #32 | Exceptional 5.5% |
| Immigrants | Pakistan | 100.0 /100 | #33 | Exceptional 5.5% |
| Immigrants | Asia | 100.0 /100 | #34 | Exceptional 5.5% |
| Afghans | 100.0 /100 | #35 | Exceptional 5.5% |
| Immigrants | Malaysia | 100.0 /100 | #36 | Exceptional 5.5% |
| Turks | 100.0 /100 | #37 | Exceptional 5.5% |
| Cypriots | 100.0 /100 | #38 | Exceptional 5.5% |
| Immigrants | Eritrea | 100.0 /100 | #39 | Exceptional 5.5% |
| Venezuelans | 99.9 /100 | #40 | Exceptional 5.5% |
| Mongolians | 99.9 /100 | #41 | Exceptional 5.5% |
| Argentineans | 99.9 /100 | #42 | Exceptional 5.5% |
| Paraguayans | 99.9 /100 | #43 | Exceptional 5.5% |
| Immigrants | Indonesia | 99.9 /100 | #44 | Exceptional 5.5% |
| Immigrants | Sweden | 99.9 /100 | #45 | Exceptional 5.6% |
| Egyptians | 99.9 /100 | #46 | Exceptional 5.6% |
Demographics Similar to Houma by Ambulatory Disability
In terms of ambulatory disability, the demographic groups most similar to Houma are Lumbee (9.5%, a difference of 2.5%), Puerto Rican (8.9%, a difference of 4.9%), Tsimshian (8.8%, a difference of 5.5%), Tohono O'odham (8.7%, a difference of 6.5%), and Kiowa (8.6%, a difference of 8.1%).
| Demographics | Rating | Rank | Ambulatory Disability |
| Cherokee | 0.0 /100 | #333 | Tragic 7.9% |
| Yuman | 0.0 /100 | #334 | Tragic 7.9% |
| Chickasaw | 0.0 /100 | #335 | Tragic 8.0% |
| Seminole | 0.0 /100 | #336 | Tragic 8.0% |
| Dutch West Indians | 0.0 /100 | #337 | Tragic 8.2% |
| Colville | 0.0 /100 | #338 | Tragic 8.2% |
| Pima | 0.0 /100 | #339 | Tragic 8.2% |
| Choctaw | 0.0 /100 | #340 | Tragic 8.3% |
| Creek | 0.0 /100 | #341 | Tragic 8.5% |
| Kiowa | 0.0 /100 | #342 | Tragic 8.6% |
| Tohono O'odham | 0.0 /100 | #343 | Tragic 8.7% |
| Tsimshian | 0.0 /100 | #344 | Tragic 8.8% |
| Puerto Ricans | 0.0 /100 | #345 | Tragic 8.9% |
| Houma | 0.0 /100 | #346 | Tragic 9.3% |
| Lumbee | 0.0 /100 | #347 | Tragic 9.5% |