Immigrants from Eritrea vs Houma Female Poverty Among 25-34 Year Olds
COMPARE
Immigrants from Eritrea
Houma
Female Poverty Among 25-34 Year Olds
Female Poverty Among 25-34 Year Olds Comparison
Immigrants from Eritrea
Houma
13.7%
FEMALE POVERTY AMONG 25-34 YEAR OLDS
32.7/ 100
METRIC RATING
188th/ 347
METRIC RANK
22.7%
FEMALE POVERTY AMONG 25-34 YEAR OLDS
0.0/ 100
METRIC RATING
338th/ 347
METRIC RANK
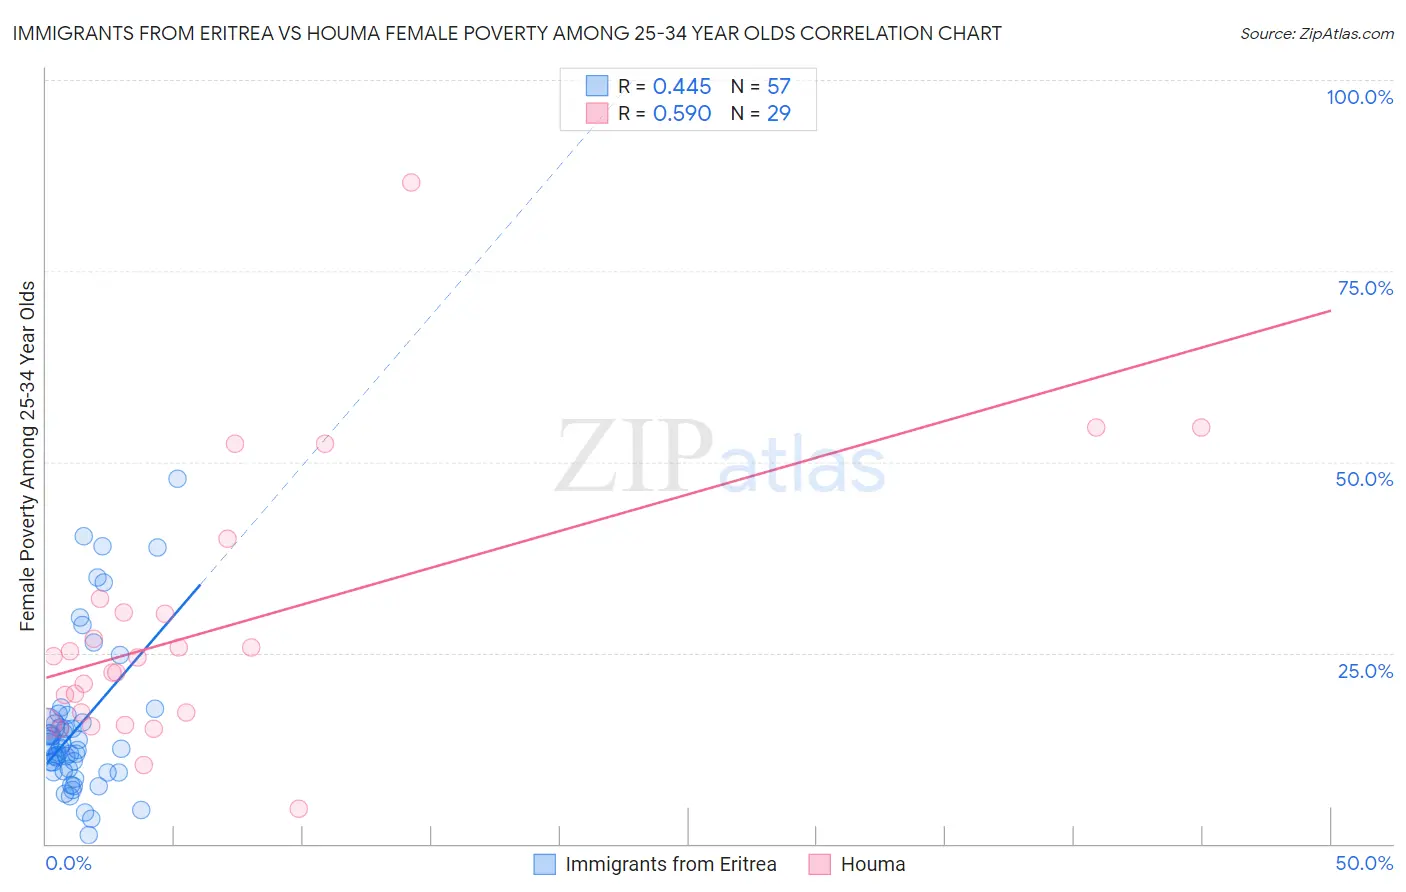
Immigrants from Eritrea vs Houma Female Poverty Among 25-34 Year Olds Correlation Chart
The statistical analysis conducted on geographies consisting of 104,678,309 people shows a moderate positive correlation between the proportion of Immigrants from Eritrea and poverty level among females between the ages 25 and 34 in the United States with a correlation coefficient (R) of 0.445 and weighted average of 13.7%. Similarly, the statistical analysis conducted on geographies consisting of 36,714,026 people shows a substantial positive correlation between the proportion of Houma and poverty level among females between the ages 25 and 34 in the United States with a correlation coefficient (R) of 0.590 and weighted average of 22.7%, a difference of 65.4%.
Female Poverty Among 25-34 Year Olds Correlation Summary
| Measurement | Immigrants from Eritrea | Houma |
| Minimum | 1.2% | 4.5% |
| Maximum | 47.9% | 86.6% |
| Range | 46.6% | 82.1% |
| Mean | 15.4% | 28.1% |
| Median | 12.6% | 24.3% |
| Interquartile 25% (IQ1) | 9.5% | 16.5% |
| Interquartile 75% (IQ3) | 16.4% | 31.2% |
| Interquartile Range (IQR) | 6.9% | 14.7% |
| Standard Deviation (Sample) | 10.0% | 17.3% |
| Standard Deviation (Population) | 9.9% | 17.0% |
Similar Demographics by Female Poverty Among 25-34 Year Olds
Demographics Similar to Immigrants from Eritrea by Female Poverty Among 25-34 Year Olds
In terms of female poverty among 25-34 year olds, the demographic groups most similar to Immigrants from Eritrea are Finnish (13.7%, a difference of 0.020%), Immigrants from Uruguay (13.7%, a difference of 0.13%), Slovak (13.7%, a difference of 0.13%), Irish (13.7%, a difference of 0.24%), and Dutch (13.8%, a difference of 0.28%).
| Demographics | Rating | Rank | Female Poverty Among 25-34 Year Olds |
| Guamanians/Chamorros | 41.5 /100 | #181 | Average 13.6% |
| Immigrants | Venezuela | 40.7 /100 | #182 | Average 13.6% |
| Portuguese | 40.3 /100 | #183 | Average 13.6% |
| Czechoslovakians | 36.8 /100 | #184 | Fair 13.7% |
| Irish | 35.3 /100 | #185 | Fair 13.7% |
| Immigrants | Uruguay | 34.1 /100 | #186 | Fair 13.7% |
| Slovaks | 34.1 /100 | #187 | Fair 13.7% |
| Immigrants | Eritrea | 32.7 /100 | #188 | Fair 13.7% |
| Finns | 32.5 /100 | #189 | Fair 13.7% |
| Dutch | 29.7 /100 | #190 | Fair 13.8% |
| Immigrants | St. Vincent and the Grenadines | 29.3 /100 | #191 | Fair 13.8% |
| Tlingit-Haida | 28.1 /100 | #192 | Fair 13.8% |
| Immigrants | Kenya | 28.0 /100 | #193 | Fair 13.8% |
| Moroccans | 25.1 /100 | #194 | Fair 13.8% |
| Immigrants | Cambodia | 24.0 /100 | #195 | Fair 13.9% |
Demographics Similar to Houma by Female Poverty Among 25-34 Year Olds
In terms of female poverty among 25-34 year olds, the demographic groups most similar to Houma are Crow (22.7%, a difference of 0.17%), Yuman (22.9%, a difference of 0.85%), Sioux (23.0%, a difference of 1.0%), Pueblo (22.2%, a difference of 2.5%), and Navajo (23.3%, a difference of 2.7%).
| Demographics | Rating | Rank | Female Poverty Among 25-34 Year Olds |
| Kiowa | 0.0 /100 | #331 | Tragic 19.7% |
| Immigrants | Yemen | 0.0 /100 | #332 | Tragic 19.8% |
| Cajuns | 0.0 /100 | #333 | Tragic 19.9% |
| Apache | 0.0 /100 | #334 | Tragic 20.1% |
| Natives/Alaskans | 0.0 /100 | #335 | Tragic 20.3% |
| Pueblo | 0.0 /100 | #336 | Tragic 22.2% |
| Crow | 0.0 /100 | #337 | Tragic 22.7% |
| Houma | 0.0 /100 | #338 | Tragic 22.7% |
| Yuman | 0.0 /100 | #339 | Tragic 22.9% |
| Sioux | 0.0 /100 | #340 | Tragic 23.0% |
| Navajo | 0.0 /100 | #341 | Tragic 23.3% |
| Hopi | 0.0 /100 | #342 | Tragic 23.7% |
| Yup'ik | 0.0 /100 | #343 | Tragic 24.3% |
| Tohono O'odham | 0.0 /100 | #344 | Tragic 24.7% |
| Pima | 0.0 /100 | #345 | Tragic 25.3% |