Immigrants from Congo vs Welsh Married-Couple Family Poverty
COMPARE
Immigrants from Congo
Welsh
Married-Couple Family Poverty
Married-Couple Family Poverty Comparison
Immigrants from Congo
Welsh
6.1%
MARRIED-COUPLE FAMILY POVERTY
0.2/ 100
METRIC RATING
264th/ 347
METRIC RANK
4.3%
MARRIED-COUPLE FAMILY POVERTY
99.7/ 100
METRIC RATING
53rd/ 347
METRIC RANK
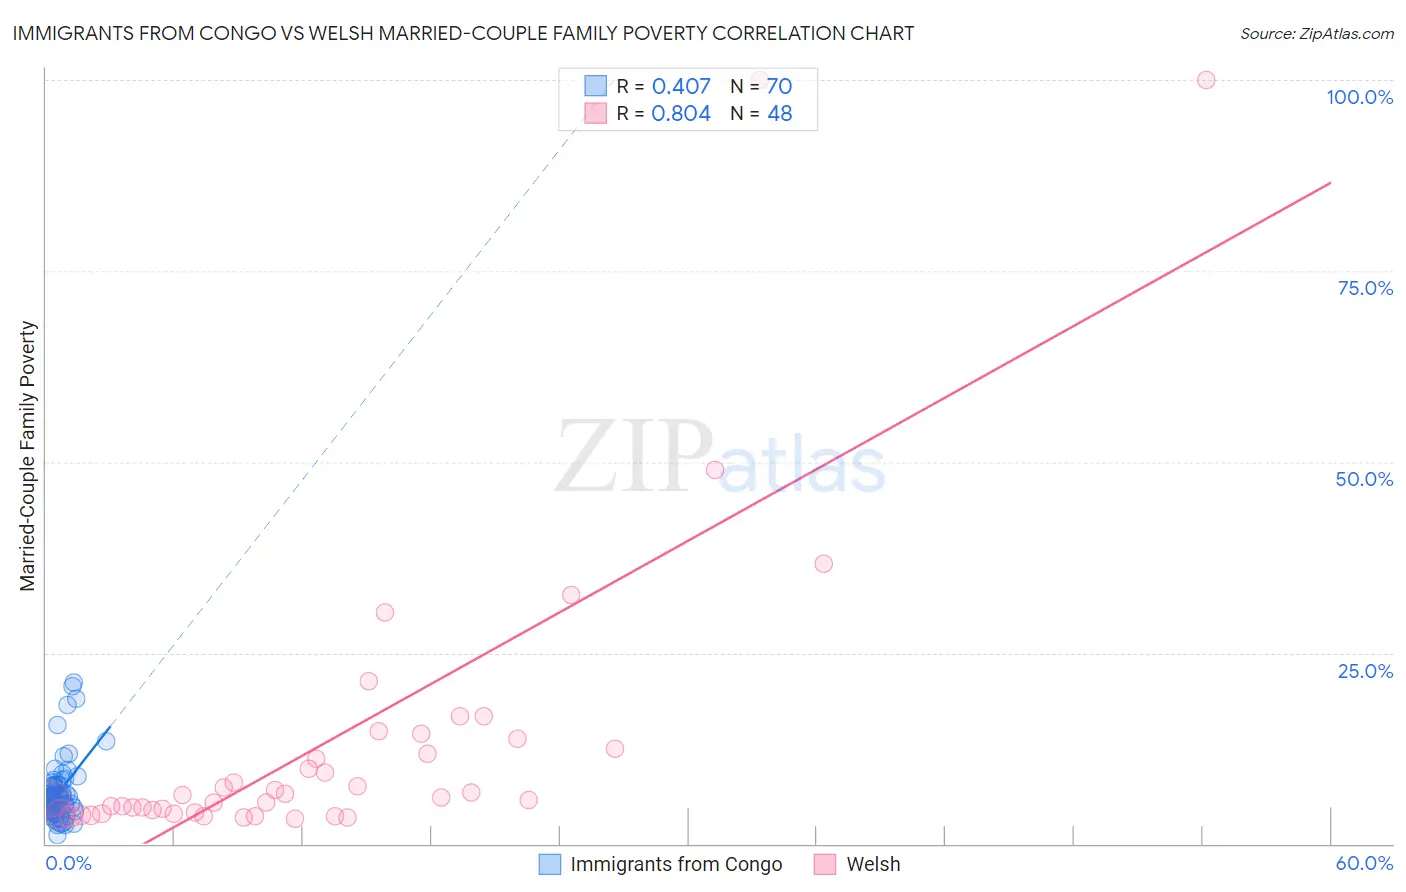
Immigrants from Congo vs Welsh Married-Couple Family Poverty Correlation Chart
The statistical analysis conducted on geographies consisting of 91,968,062 people shows a moderate positive correlation between the proportion of Immigrants from Congo and poverty level among married-couple families in the United States with a correlation coefficient (R) of 0.407 and weighted average of 6.1%. Similarly, the statistical analysis conducted on geographies consisting of 518,114,778 people shows a very strong positive correlation between the proportion of Welsh and poverty level among married-couple families in the United States with a correlation coefficient (R) of 0.804 and weighted average of 4.3%, a difference of 41.9%.
Married-Couple Family Poverty Correlation Summary
| Measurement | Immigrants from Congo | Welsh |
| Minimum | 1.1% | 3.3% |
| Maximum | 21.1% | 100.0% |
| Range | 20.0% | 96.7% |
| Mean | 6.8% | 13.6% |
| Median | 6.0% | 6.3% |
| Interquartile 25% (IQ1) | 4.3% | 4.1% |
| Interquartile 75% (IQ3) | 7.7% | 13.2% |
| Interquartile Range (IQR) | 3.3% | 9.1% |
| Standard Deviation (Sample) | 4.1% | 20.5% |
| Standard Deviation (Population) | 4.1% | 20.3% |
Similar Demographics by Married-Couple Family Poverty
Demographics Similar to Immigrants from Congo by Married-Couple Family Poverty
In terms of married-couple family poverty, the demographic groups most similar to Immigrants from Congo are Immigrants from Senegal (6.1%, a difference of 0.22%), Blackfeet (6.2%, a difference of 0.43%), Creek (6.2%, a difference of 0.51%), Spanish American (6.2%, a difference of 0.56%), and Shoshone (6.1%, a difference of 0.62%).
| Demographics | Rating | Rank | Married-Couple Family Poverty |
| Immigrants | Burma/Myanmar | 0.5 /100 | #257 | Tragic 6.0% |
| Immigrants | Immigrants | 0.5 /100 | #258 | Tragic 6.0% |
| Alaskan Athabascans | 0.4 /100 | #259 | Tragic 6.1% |
| Jamaicans | 0.3 /100 | #260 | Tragic 6.1% |
| Senegalese | 0.3 /100 | #261 | Tragic 6.1% |
| Shoshone | 0.3 /100 | #262 | Tragic 6.1% |
| Immigrants | Senegal | 0.3 /100 | #263 | Tragic 6.1% |
| Immigrants | Congo | 0.2 /100 | #264 | Tragic 6.1% |
| Blackfeet | 0.2 /100 | #265 | Tragic 6.2% |
| Creek | 0.2 /100 | #266 | Tragic 6.2% |
| Spanish Americans | 0.2 /100 | #267 | Tragic 6.2% |
| Alaska Natives | 0.2 /100 | #268 | Tragic 6.2% |
| Immigrants | West Indies | 0.1 /100 | #269 | Tragic 6.2% |
| Immigrants | Jamaica | 0.1 /100 | #270 | Tragic 6.2% |
| Immigrants | Bahamas | 0.1 /100 | #271 | Tragic 6.2% |
Demographics Similar to Welsh by Married-Couple Family Poverty
In terms of married-couple family poverty, the demographic groups most similar to Welsh are Russian (4.3%, a difference of 0.15%), Immigrants from Lithuania (4.3%, a difference of 0.18%), Burmese (4.3%, a difference of 0.19%), Austrian (4.3%, a difference of 0.26%), and Turkish (4.3%, a difference of 0.29%).
| Demographics | Rating | Rank | Married-Couple Family Poverty |
| British | 99.8 /100 | #46 | Exceptional 4.3% |
| Immigrants | South Central Asia | 99.8 /100 | #47 | Exceptional 4.3% |
| Australians | 99.7 /100 | #48 | Exceptional 4.3% |
| Turks | 99.7 /100 | #49 | Exceptional 4.3% |
| Burmese | 99.7 /100 | #50 | Exceptional 4.3% |
| Immigrants | Lithuania | 99.7 /100 | #51 | Exceptional 4.3% |
| Russians | 99.7 /100 | #52 | Exceptional 4.3% |
| Welsh | 99.7 /100 | #53 | Exceptional 4.3% |
| Austrians | 99.7 /100 | #54 | Exceptional 4.3% |
| French | 99.7 /100 | #55 | Exceptional 4.3% |
| Immigrants | Zimbabwe | 99.7 /100 | #56 | Exceptional 4.3% |
| Immigrants | Netherlands | 99.7 /100 | #57 | Exceptional 4.3% |
| Czechoslovakians | 99.7 /100 | #58 | Exceptional 4.4% |
| Immigrants | Sweden | 99.6 /100 | #59 | Exceptional 4.4% |
| Tlingit-Haida | 99.6 /100 | #60 | Exceptional 4.4% |