Immigrants from Canada vs Greek In Labor Force | Age > 16
COMPARE
Immigrants from Canada
Greek
In Labor Force | Age > 16
In Labor Force | Age > 16 Comparison
Immigrants from Canada
Greeks
63.7%
IN LABOR FORCE | AGE > 16
0.0/ 100
METRIC RATING
295th/ 347
METRIC RANK
64.9%
IN LABOR FORCE | AGE > 16
26.1/ 100
METRIC RATING
198th/ 347
METRIC RANK
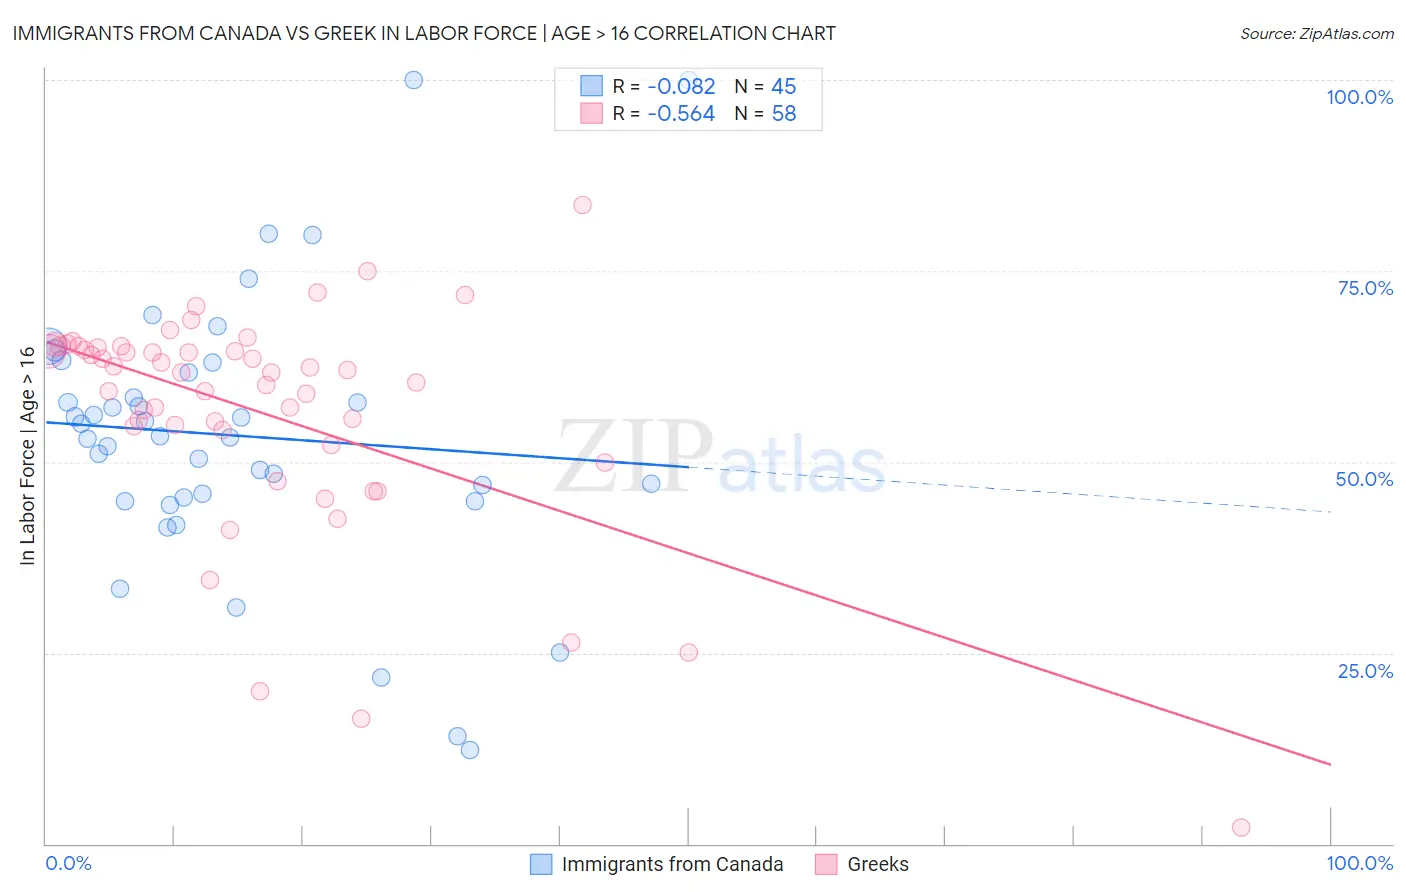
Immigrants from Canada vs Greek In Labor Force | Age > 16 Correlation Chart
The statistical analysis conducted on geographies consisting of 459,409,569 people shows a slight negative correlation between the proportion of Immigrants from Canada and labor force participation rate among population ages 16 and over in the United States with a correlation coefficient (R) of -0.082 and weighted average of 63.7%. Similarly, the statistical analysis conducted on geographies consisting of 482,783,671 people shows a substantial negative correlation between the proportion of Greeks and labor force participation rate among population ages 16 and over in the United States with a correlation coefficient (R) of -0.564 and weighted average of 64.9%, a difference of 1.9%.
In Labor Force | Age > 16 Correlation Summary
| Measurement | Immigrants from Canada | Greek |
| Minimum | 12.2% | 2.1% |
| Maximum | 100.0% | 83.6% |
| Range | 87.8% | 81.5% |
| Mean | 53.4% | 56.5% |
| Median | 53.3% | 61.7% |
| Interquartile 25% (IQ1) | 45.2% | 54.1% |
| Interquartile 75% (IQ3) | 62.4% | 65.0% |
| Interquartile Range (IQR) | 17.2% | 10.9% |
| Standard Deviation (Sample) | 17.8% | 14.9% |
| Standard Deviation (Population) | 17.6% | 14.8% |
Similar Demographics by In Labor Force | Age > 16
Demographics Similar to Immigrants from Canada by In Labor Force | Age > 16
In terms of in labor force | age > 16, the demographic groups most similar to Immigrants from Canada are Immigrants from North America (63.7%, a difference of 0.020%), Puget Sound Salish (63.7%, a difference of 0.050%), English (63.7%, a difference of 0.080%), Immigrants from Grenada (63.6%, a difference of 0.10%), and Comanche (63.6%, a difference of 0.11%).
| Demographics | Rating | Rank | In Labor Force | Age > 16 |
| Spanish | 0.1 /100 | #288 | Tragic 63.9% |
| Celtics | 0.1 /100 | #289 | Tragic 63.8% |
| Hungarians | 0.1 /100 | #290 | Tragic 63.8% |
| Nepalese | 0.1 /100 | #291 | Tragic 63.8% |
| Spanish American Indians | 0.1 /100 | #292 | Tragic 63.8% |
| English | 0.1 /100 | #293 | Tragic 63.7% |
| Puget Sound Salish | 0.0 /100 | #294 | Tragic 63.7% |
| Immigrants | Canada | 0.0 /100 | #295 | Tragic 63.7% |
| Immigrants | North America | 0.0 /100 | #296 | Tragic 63.7% |
| Immigrants | Grenada | 0.0 /100 | #297 | Tragic 63.6% |
| Comanche | 0.0 /100 | #298 | Tragic 63.6% |
| Whites/Caucasians | 0.0 /100 | #299 | Tragic 63.6% |
| Immigrants | Azores | 0.0 /100 | #300 | Tragic 63.6% |
| Spanish Americans | 0.0 /100 | #301 | Tragic 63.6% |
| Delaware | 0.0 /100 | #302 | Tragic 63.6% |
Demographics Similar to Greeks by In Labor Force | Age > 16
In terms of in labor force | age > 16, the demographic groups most similar to Greeks are Immigrants from Italy (65.0%, a difference of 0.040%), Mexican American Indian (64.9%, a difference of 0.050%), Haitian (65.0%, a difference of 0.060%), Immigrants from Southern Europe (65.0%, a difference of 0.070%), and Romanian (65.0%, a difference of 0.070%).
| Demographics | Rating | Rank | In Labor Force | Age > 16 |
| Scandinavians | 33.7 /100 | #191 | Fair 65.0% |
| Immigrants | Fiji | 33.7 /100 | #192 | Fair 65.0% |
| Immigrants | Europe | 33.6 /100 | #193 | Fair 65.0% |
| Immigrants | Southern Europe | 31.3 /100 | #194 | Fair 65.0% |
| Romanians | 31.1 /100 | #195 | Fair 65.0% |
| Haitians | 30.6 /100 | #196 | Fair 65.0% |
| Immigrants | Italy | 28.7 /100 | #197 | Fair 65.0% |
| Greeks | 26.1 /100 | #198 | Fair 64.9% |
| Mexican American Indians | 23.1 /100 | #199 | Fair 64.9% |
| Armenians | 20.2 /100 | #200 | Fair 64.9% |
| Ukrainians | 19.6 /100 | #201 | Poor 64.9% |
| Immigrants | Belgium | 19.4 /100 | #202 | Poor 64.9% |
| Russians | 18.8 /100 | #203 | Poor 64.9% |
| Slovenes | 18.7 /100 | #204 | Poor 64.9% |
| Jamaicans | 18.7 /100 | #205 | Poor 64.9% |