Immigrants from Burma/Myanmar vs Immigrants from Sudan Female Unemployment
COMPARE
Immigrants from Burma/Myanmar
Immigrants from Sudan
Female Unemployment
Female Unemployment Comparison
Immigrants from Burma/Myanmar
Immigrants from Sudan
5.1%
FEMALE UNEMPLOYMENT
92.3/ 100
METRIC RATING
111th/ 347
METRIC RANK
5.0%
FEMALE UNEMPLOYMENT
96.7/ 100
METRIC RATING
88th/ 347
METRIC RANK
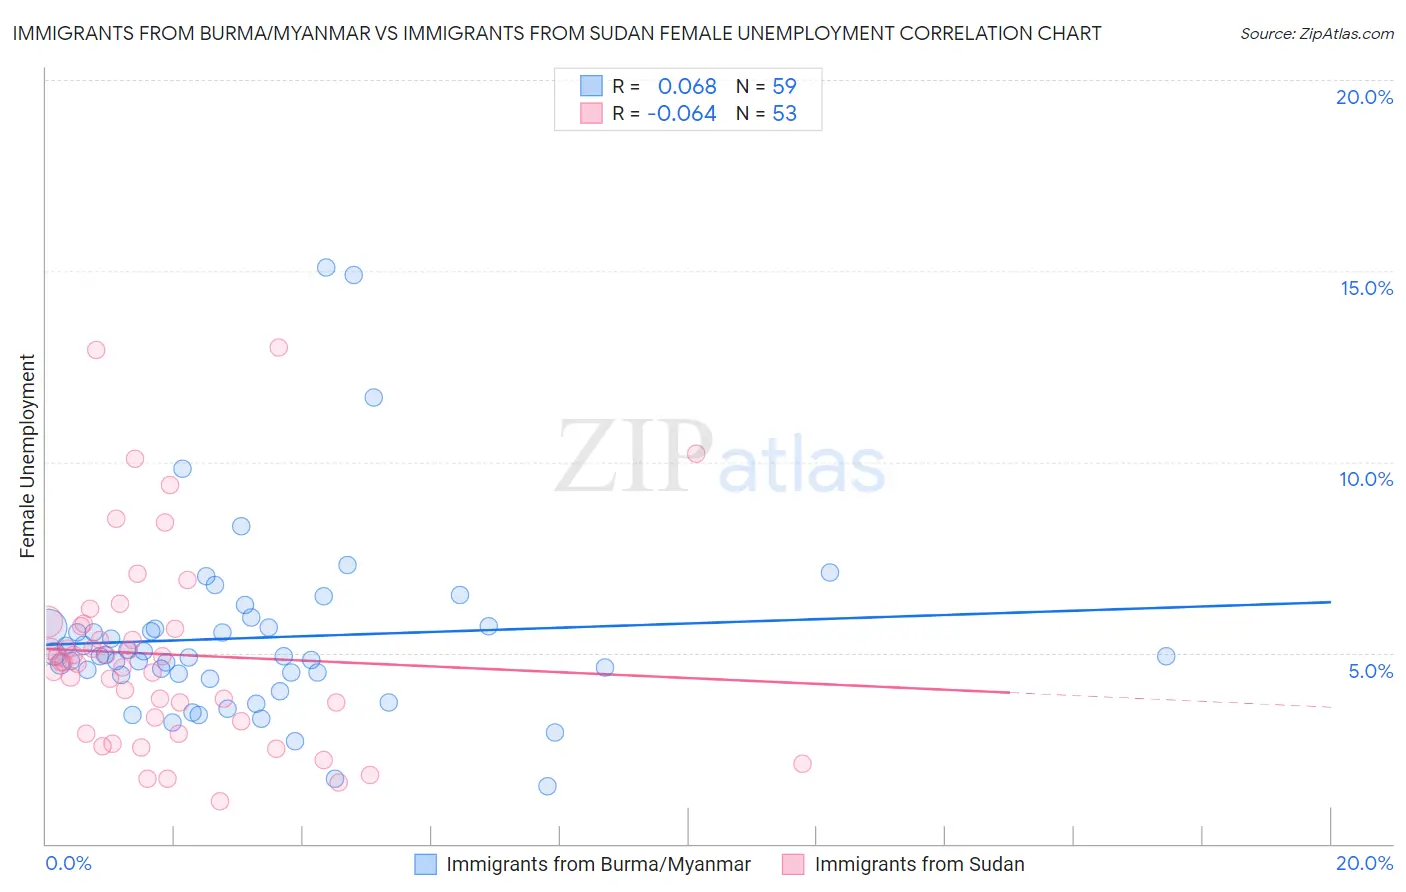
Immigrants from Burma/Myanmar vs Immigrants from Sudan Female Unemployment Correlation Chart
The statistical analysis conducted on geographies consisting of 172,103,877 people shows a slight positive correlation between the proportion of Immigrants from Burma/Myanmar and unemploymnet rate among females in the United States with a correlation coefficient (R) of 0.068 and weighted average of 5.1%. Similarly, the statistical analysis conducted on geographies consisting of 118,886,024 people shows a slight negative correlation between the proportion of Immigrants from Sudan and unemploymnet rate among females in the United States with a correlation coefficient (R) of -0.064 and weighted average of 5.0%, a difference of 1.5%.
Female Unemployment Correlation Summary
| Measurement | Immigrants from Burma/Myanmar | Immigrants from Sudan |
| Minimum | 1.5% | 1.1% |
| Maximum | 15.1% | 13.0% |
| Range | 13.6% | 11.9% |
| Mean | 5.4% | 5.0% |
| Median | 4.9% | 4.7% |
| Interquartile 25% (IQ1) | 4.4% | 3.0% |
| Interquartile 75% (IQ3) | 5.7% | 5.7% |
| Interquartile Range (IQR) | 1.3% | 2.7% |
| Standard Deviation (Sample) | 2.5% | 2.6% |
| Standard Deviation (Population) | 2.4% | 2.6% |
Similar Demographics by Female Unemployment
Demographics Similar to Immigrants from Burma/Myanmar by Female Unemployment
In terms of female unemployment, the demographic groups most similar to Immigrants from Burma/Myanmar are Macedonian (5.1%, a difference of 0.030%), Estonian (5.1%, a difference of 0.030%), Immigrants from Eastern Africa (5.1%, a difference of 0.13%), Puget Sound Salish (5.1%, a difference of 0.17%), and Immigrants from Switzerland (5.1%, a difference of 0.20%).
| Demographics | Rating | Rank | Female Unemployment |
| Kenyans | 93.7 /100 | #104 | Exceptional 5.0% |
| Immigrants | England | 93.6 /100 | #105 | Exceptional 5.0% |
| Paraguayans | 93.2 /100 | #106 | Exceptional 5.1% |
| Immigrants | Switzerland | 93.1 /100 | #107 | Exceptional 5.1% |
| Puget Sound Salish | 93.0 /100 | #108 | Exceptional 5.1% |
| Immigrants | Eastern Africa | 92.8 /100 | #109 | Exceptional 5.1% |
| Macedonians | 92.4 /100 | #110 | Exceptional 5.1% |
| Immigrants | Burma/Myanmar | 92.3 /100 | #111 | Exceptional 5.1% |
| Estonians | 92.1 /100 | #112 | Exceptional 5.1% |
| Immigrants | Saudi Arabia | 91.2 /100 | #113 | Exceptional 5.1% |
| Immigrants | Turkey | 91.0 /100 | #114 | Exceptional 5.1% |
| Lebanese | 91.0 /100 | #115 | Exceptional 5.1% |
| Americans | 90.5 /100 | #116 | Exceptional 5.1% |
| Jordanians | 90.3 /100 | #117 | Exceptional 5.1% |
| Immigrants | Croatia | 89.9 /100 | #118 | Excellent 5.1% |
Demographics Similar to Immigrants from Sudan by Female Unemployment
In terms of female unemployment, the demographic groups most similar to Immigrants from Sudan are Immigrants from Taiwan (5.0%, a difference of 0.060%), Venezuelan (5.0%, a difference of 0.090%), Bolivian (5.0%, a difference of 0.18%), Ukrainian (5.0%, a difference of 0.19%), and Immigrants from Sweden (5.0%, a difference of 0.22%).
| Demographics | Rating | Rank | Female Unemployment |
| Filipinos | 97.3 /100 | #81 | Exceptional 5.0% |
| Immigrants | Australia | 97.3 /100 | #82 | Exceptional 5.0% |
| Immigrants | Serbia | 97.2 /100 | #83 | Exceptional 5.0% |
| Canadians | 97.2 /100 | #84 | Exceptional 5.0% |
| Ukrainians | 97.1 /100 | #85 | Exceptional 5.0% |
| Bolivians | 97.1 /100 | #86 | Exceptional 5.0% |
| Venezuelans | 96.9 /100 | #87 | Exceptional 5.0% |
| Immigrants | Sudan | 96.7 /100 | #88 | Exceptional 5.0% |
| Immigrants | Taiwan | 96.6 /100 | #89 | Exceptional 5.0% |
| Immigrants | Sweden | 96.3 /100 | #90 | Exceptional 5.0% |
| Immigrants | Japan | 96.0 /100 | #91 | Exceptional 5.0% |
| Romanians | 95.9 /100 | #92 | Exceptional 5.0% |
| Immigrants | Austria | 95.7 /100 | #93 | Exceptional 5.0% |
| Immigrants | Malaysia | 95.7 /100 | #94 | Exceptional 5.0% |
| Burmese | 95.6 /100 | #95 | Exceptional 5.0% |