Icelander vs Puget Sound Salish Single Male Poverty
COMPARE
Icelander
Puget Sound Salish
Single Male Poverty
Single Male Poverty Comparison
Icelanders
Puget Sound Salish
12.5%
SINGLE MALE POVERTY
88.2/ 100
METRIC RATING
121st/ 347
METRIC RANK
12.8%
SINGLE MALE POVERTY
54.3/ 100
METRIC RATING
169th/ 347
METRIC RANK
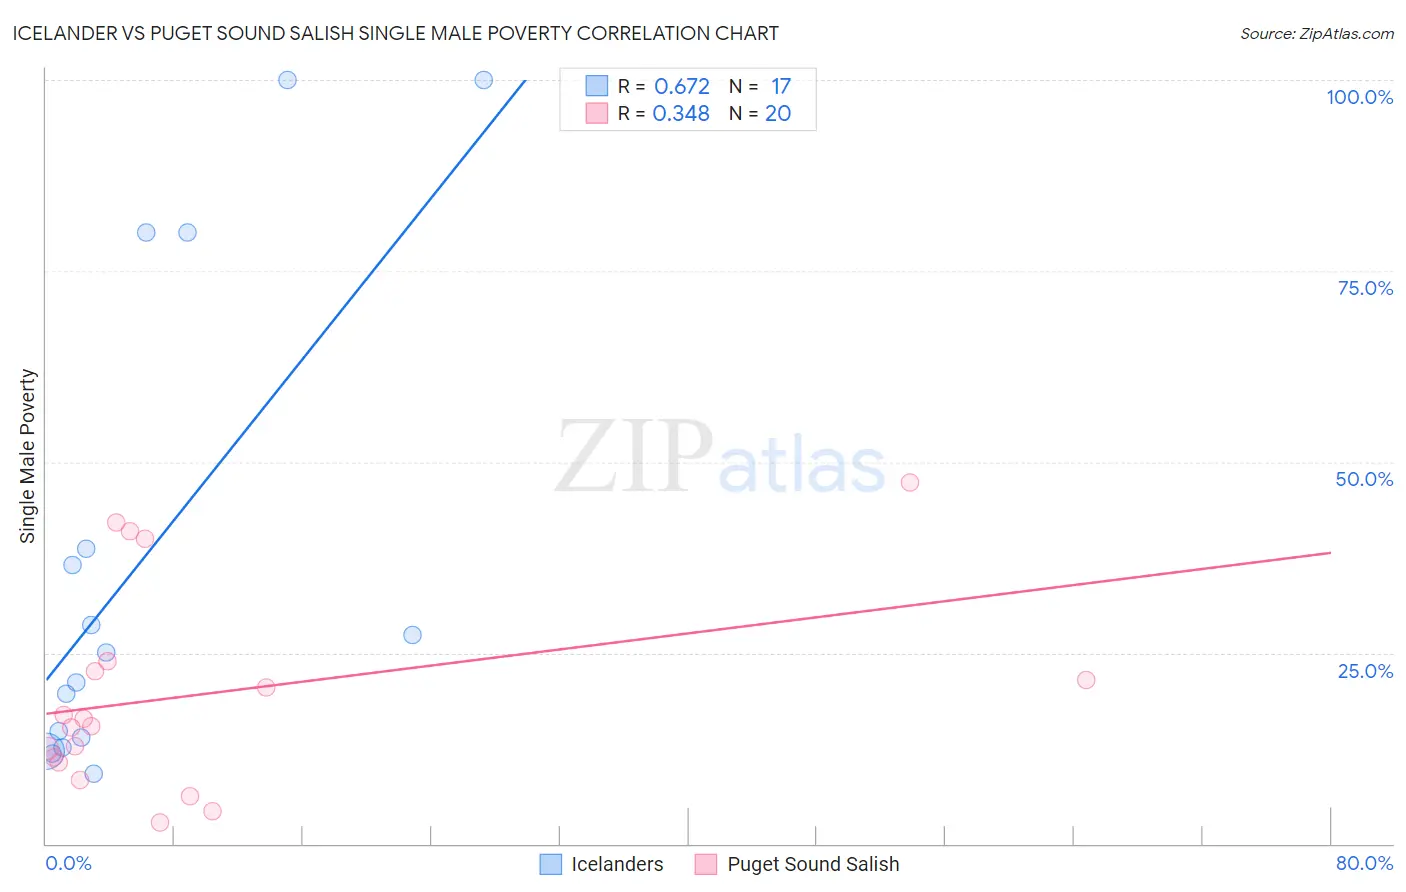
Icelander vs Puget Sound Salish Single Male Poverty Correlation Chart
The statistical analysis conducted on geographies consisting of 148,220,666 people shows a significant positive correlation between the proportion of Icelanders and poverty level among single males in the United States with a correlation coefficient (R) of 0.672 and weighted average of 12.5%. Similarly, the statistical analysis conducted on geographies consisting of 44,306,636 people shows a mild positive correlation between the proportion of Puget Sound Salish and poverty level among single males in the United States with a correlation coefficient (R) of 0.348 and weighted average of 12.8%, a difference of 2.5%.
Single Male Poverty Correlation Summary
| Measurement | Icelander | Puget Sound Salish |
| Minimum | 9.1% | 2.8% |
| Maximum | 100.0% | 47.4% |
| Range | 90.9% | 44.6% |
| Mean | 37.1% | 19.6% |
| Median | 25.0% | 15.9% |
| Interquartile 25% (IQ1) | 13.3% | 10.9% |
| Interquartile 75% (IQ3) | 59.3% | 23.3% |
| Interquartile Range (IQR) | 46.1% | 12.4% |
| Standard Deviation (Sample) | 31.8% | 13.2% |
| Standard Deviation (Population) | 30.8% | 12.9% |
Similar Demographics by Single Male Poverty
Demographics Similar to Icelanders by Single Male Poverty
In terms of single male poverty, the demographic groups most similar to Icelanders are Serbian (12.5%, a difference of 0.050%), Immigrants from Kenya (12.5%, a difference of 0.090%), Russian (12.5%, a difference of 0.12%), Immigrants from Jordan (12.5%, a difference of 0.15%), and Venezuelan (12.4%, a difference of 0.16%).
| Demographics | Rating | Rank | Single Male Poverty |
| Nicaraguans | 92.1 /100 | #114 | Exceptional 12.4% |
| Immigrants | Southern Europe | 91.5 /100 | #115 | Exceptional 12.4% |
| Immigrants | Syria | 91.2 /100 | #116 | Exceptional 12.4% |
| Immigrants | Oceania | 91.1 /100 | #117 | Exceptional 12.4% |
| Albanians | 90.6 /100 | #118 | Exceptional 12.4% |
| Immigrants | Albania | 90.3 /100 | #119 | Exceptional 12.4% |
| Venezuelans | 89.4 /100 | #120 | Excellent 12.4% |
| Icelanders | 88.2 /100 | #121 | Excellent 12.5% |
| Serbians | 87.9 /100 | #122 | Excellent 12.5% |
| Immigrants | Kenya | 87.6 /100 | #123 | Excellent 12.5% |
| Russians | 87.3 /100 | #124 | Excellent 12.5% |
| Immigrants | Jordan | 87.1 /100 | #125 | Excellent 12.5% |
| Romanians | 86.4 /100 | #126 | Excellent 12.5% |
| Immigrants | Netherlands | 86.2 /100 | #127 | Excellent 12.5% |
| Ecuadorians | 85.9 /100 | #128 | Excellent 12.5% |
Demographics Similar to Puget Sound Salish by Single Male Poverty
In terms of single male poverty, the demographic groups most similar to Puget Sound Salish are Guyanese (12.8%, a difference of 0.12%), South African (12.8%, a difference of 0.15%), Danish (12.8%, a difference of 0.15%), Immigrants from Barbados (12.7%, a difference of 0.18%), and Immigrants from St. Vincent and the Grenadines (12.8%, a difference of 0.18%).
| Demographics | Rating | Rank | Single Male Poverty |
| Eastern Europeans | 63.3 /100 | #162 | Good 12.7% |
| Palestinians | 63.1 /100 | #163 | Good 12.7% |
| Immigrants | Nigeria | 62.8 /100 | #164 | Good 12.7% |
| Immigrants | Cambodia | 62.2 /100 | #165 | Good 12.7% |
| Immigrants | Guyana | 60.5 /100 | #166 | Good 12.7% |
| Immigrants | Sudan | 58.2 /100 | #167 | Average 12.7% |
| Immigrants | Barbados | 57.7 /100 | #168 | Average 12.7% |
| Puget Sound Salish | 54.3 /100 | #169 | Average 12.8% |
| Guyanese | 52.0 /100 | #170 | Average 12.8% |
| South Africans | 51.5 /100 | #171 | Average 12.8% |
| Danes | 51.4 /100 | #172 | Average 12.8% |
| Immigrants | St. Vincent and the Grenadines | 50.9 /100 | #173 | Average 12.8% |
| Costa Ricans | 50.0 /100 | #174 | Average 12.8% |
| Croatians | 48.9 /100 | #175 | Average 12.8% |
| Syrians | 48.4 /100 | #176 | Average 12.8% |