Icelander vs Immigrants from Lebanon Single Male Poverty
COMPARE
Icelander
Immigrants from Lebanon
Single Male Poverty
Single Male Poverty Comparison
Icelanders
Immigrants from Lebanon
12.5%
SINGLE MALE POVERTY
88.2/ 100
METRIC RATING
121st/ 347
METRIC RANK
12.6%
SINGLE MALE POVERTY
75.0/ 100
METRIC RATING
145th/ 347
METRIC RANK
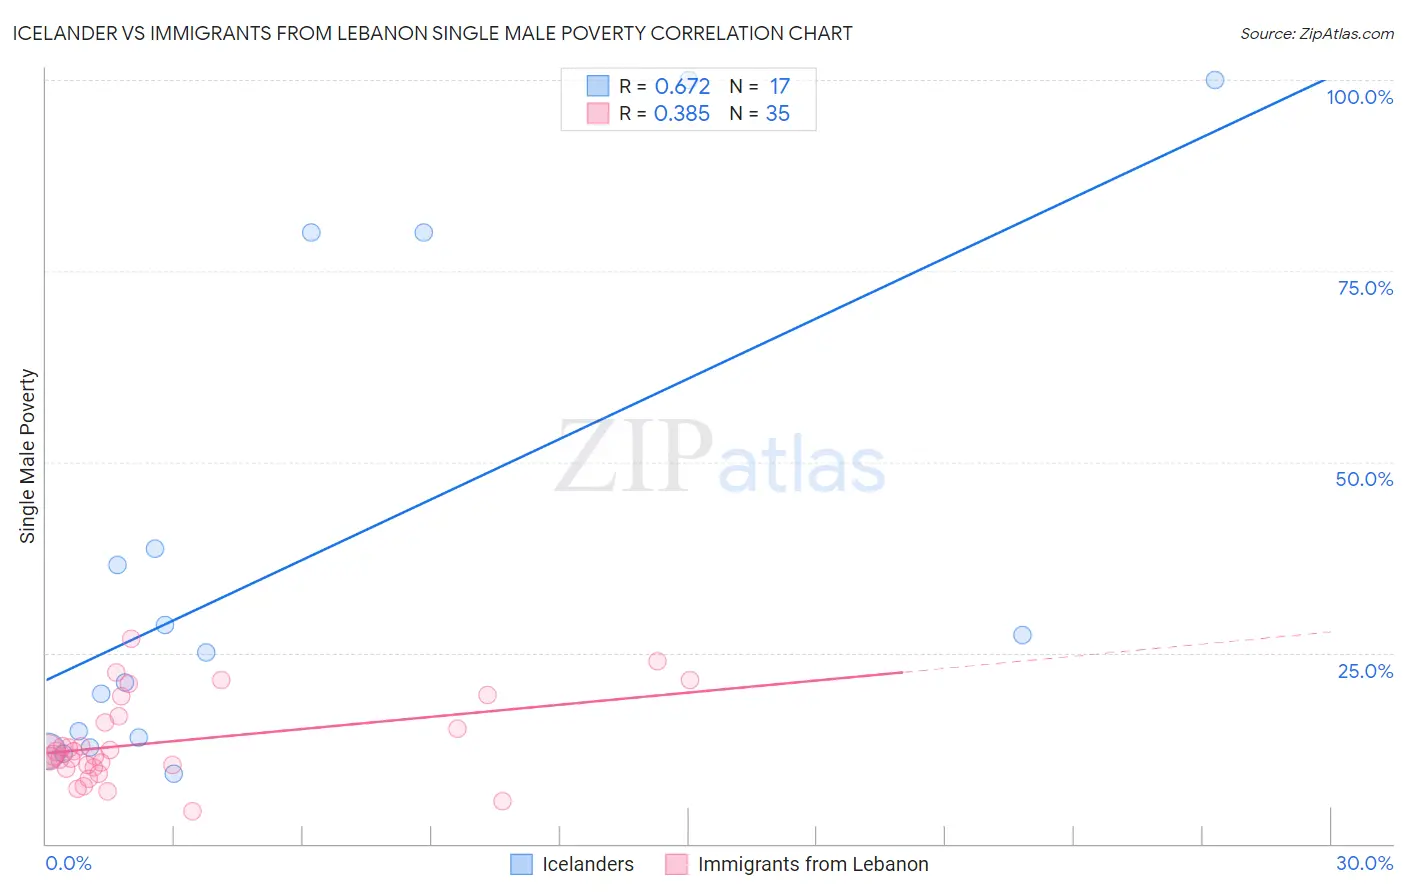
Icelander vs Immigrants from Lebanon Single Male Poverty Correlation Chart
The statistical analysis conducted on geographies consisting of 148,220,666 people shows a significant positive correlation between the proportion of Icelanders and poverty level among single males in the United States with a correlation coefficient (R) of 0.672 and weighted average of 12.5%. Similarly, the statistical analysis conducted on geographies consisting of 197,960,009 people shows a mild positive correlation between the proportion of Immigrants from Lebanon and poverty level among single males in the United States with a correlation coefficient (R) of 0.385 and weighted average of 12.6%, a difference of 1.2%.
Single Male Poverty Correlation Summary
| Measurement | Icelander | Immigrants from Lebanon |
| Minimum | 9.1% | 4.3% |
| Maximum | 100.0% | 26.9% |
| Range | 90.9% | 22.5% |
| Mean | 37.1% | 13.3% |
| Median | 25.0% | 12.1% |
| Interquartile 25% (IQ1) | 13.3% | 10.0% |
| Interquartile 75% (IQ3) | 59.3% | 16.6% |
| Interquartile Range (IQR) | 46.1% | 6.7% |
| Standard Deviation (Sample) | 31.8% | 5.5% |
| Standard Deviation (Population) | 30.8% | 5.4% |
Similar Demographics by Single Male Poverty
Demographics Similar to Icelanders by Single Male Poverty
In terms of single male poverty, the demographic groups most similar to Icelanders are Serbian (12.5%, a difference of 0.050%), Immigrants from Kenya (12.5%, a difference of 0.090%), Russian (12.5%, a difference of 0.12%), Immigrants from Jordan (12.5%, a difference of 0.15%), and Venezuelan (12.4%, a difference of 0.16%).
| Demographics | Rating | Rank | Single Male Poverty |
| Nicaraguans | 92.1 /100 | #114 | Exceptional 12.4% |
| Immigrants | Southern Europe | 91.5 /100 | #115 | Exceptional 12.4% |
| Immigrants | Syria | 91.2 /100 | #116 | Exceptional 12.4% |
| Immigrants | Oceania | 91.1 /100 | #117 | Exceptional 12.4% |
| Albanians | 90.6 /100 | #118 | Exceptional 12.4% |
| Immigrants | Albania | 90.3 /100 | #119 | Exceptional 12.4% |
| Venezuelans | 89.4 /100 | #120 | Excellent 12.4% |
| Icelanders | 88.2 /100 | #121 | Excellent 12.5% |
| Serbians | 87.9 /100 | #122 | Excellent 12.5% |
| Immigrants | Kenya | 87.6 /100 | #123 | Excellent 12.5% |
| Russians | 87.3 /100 | #124 | Excellent 12.5% |
| Immigrants | Jordan | 87.1 /100 | #125 | Excellent 12.5% |
| Romanians | 86.4 /100 | #126 | Excellent 12.5% |
| Immigrants | Netherlands | 86.2 /100 | #127 | Excellent 12.5% |
| Ecuadorians | 85.9 /100 | #128 | Excellent 12.5% |
Demographics Similar to Immigrants from Lebanon by Single Male Poverty
In terms of single male poverty, the demographic groups most similar to Immigrants from Lebanon are Native Hawaiian (12.6%, a difference of 0.0%), Hawaiian (12.6%, a difference of 0.010%), Malaysian (12.6%, a difference of 0.010%), Immigrants from France (12.6%, a difference of 0.060%), and Okinawan (12.6%, a difference of 0.070%).
| Demographics | Rating | Rank | Single Male Poverty |
| Immigrants | El Salvador | 80.0 /100 | #138 | Excellent 12.6% |
| Cubans | 79.9 /100 | #139 | Good 12.6% |
| Immigrants | Zimbabwe | 78.0 /100 | #140 | Good 12.6% |
| Okinawans | 75.9 /100 | #141 | Good 12.6% |
| Immigrants | Uganda | 75.9 /100 | #142 | Good 12.6% |
| Immigrants | France | 75.8 /100 | #143 | Good 12.6% |
| Hawaiians | 75.1 /100 | #144 | Good 12.6% |
| Immigrants | Lebanon | 75.0 /100 | #145 | Good 12.6% |
| Native Hawaiians | 75.0 /100 | #146 | Good 12.6% |
| Malaysians | 74.8 /100 | #147 | Good 12.6% |
| Yugoslavians | 73.9 /100 | #148 | Good 12.6% |
| Sierra Leoneans | 73.0 /100 | #149 | Good 12.6% |
| Immigrants | Panama | 72.1 /100 | #150 | Good 12.6% |
| Immigrants | Hungary | 71.9 /100 | #151 | Good 12.6% |
| Australians | 71.4 /100 | #152 | Good 12.6% |