Sudanese vs Puget Sound Salish Single Male Poverty
COMPARE
Sudanese
Puget Sound Salish
Single Male Poverty
Single Male Poverty Comparison
Sudanese
Puget Sound Salish
13.1%
SINGLE MALE POVERTY
17.7/ 100
METRIC RATING
207th/ 347
METRIC RANK
12.8%
SINGLE MALE POVERTY
54.3/ 100
METRIC RATING
169th/ 347
METRIC RANK
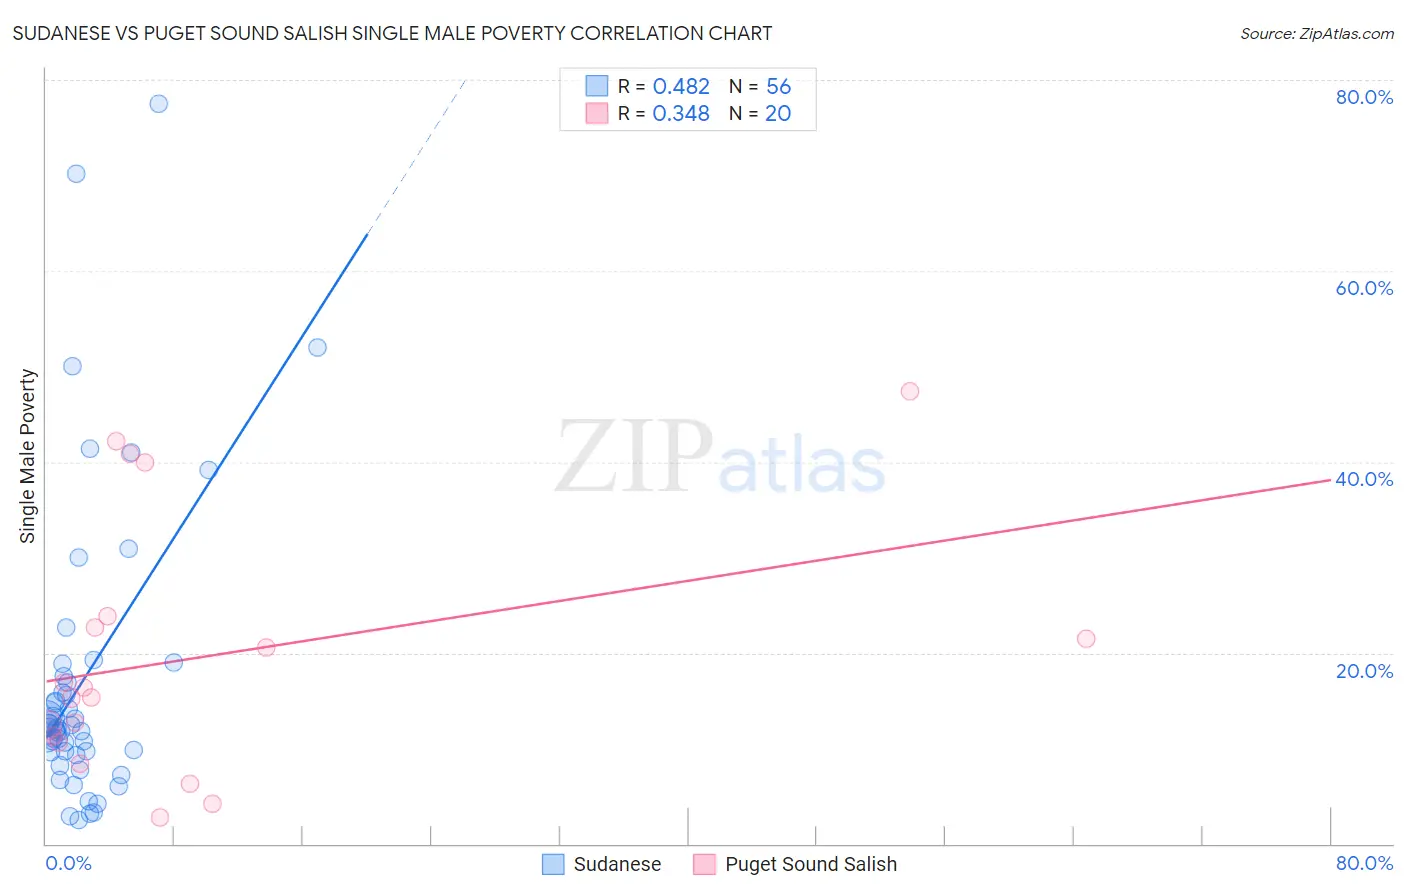
Sudanese vs Puget Sound Salish Single Male Poverty Correlation Chart
The statistical analysis conducted on geographies consisting of 106,028,362 people shows a moderate positive correlation between the proportion of Sudanese and poverty level among single males in the United States with a correlation coefficient (R) of 0.482 and weighted average of 13.1%. Similarly, the statistical analysis conducted on geographies consisting of 44,306,636 people shows a mild positive correlation between the proportion of Puget Sound Salish and poverty level among single males in the United States with a correlation coefficient (R) of 0.348 and weighted average of 12.8%, a difference of 2.3%.
Single Male Poverty Correlation Summary
| Measurement | Sudanese | Puget Sound Salish |
| Minimum | 2.5% | 2.8% |
| Maximum | 77.6% | 47.4% |
| Range | 75.0% | 44.6% |
| Mean | 17.1% | 19.6% |
| Median | 12.2% | 15.9% |
| Interquartile 25% (IQ1) | 9.6% | 10.9% |
| Interquartile 75% (IQ3) | 17.2% | 23.3% |
| Interquartile Range (IQR) | 7.5% | 12.4% |
| Standard Deviation (Sample) | 15.6% | 13.2% |
| Standard Deviation (Population) | 15.5% | 12.9% |
Similar Demographics by Single Male Poverty
Demographics Similar to Sudanese by Single Male Poverty
In terms of single male poverty, the demographic groups most similar to Sudanese are Immigrants from Western Africa (13.1%, a difference of 0.010%), Mexican American Indian (13.1%, a difference of 0.020%), Immigrants from Haiti (13.1%, a difference of 0.080%), Swedish (13.1%, a difference of 0.080%), and Northern European (13.0%, a difference of 0.10%).
| Demographics | Rating | Rank | Single Male Poverty |
| Slovenes | 21.6 /100 | #200 | Fair 13.0% |
| Trinidadians and Tobagonians | 21.4 /100 | #201 | Fair 13.0% |
| Basques | 20.7 /100 | #202 | Fair 13.0% |
| Immigrants | Bangladesh | 20.4 /100 | #203 | Fair 13.0% |
| Estonians | 20.3 /100 | #204 | Fair 13.0% |
| Poles | 19.3 /100 | #205 | Poor 13.0% |
| Northern Europeans | 18.9 /100 | #206 | Poor 13.0% |
| Sudanese | 17.7 /100 | #207 | Poor 13.1% |
| Immigrants | Western Africa | 17.6 /100 | #208 | Poor 13.1% |
| Mexican American Indians | 17.5 /100 | #209 | Poor 13.1% |
| Immigrants | Haiti | 16.8 /100 | #210 | Poor 13.1% |
| Swedes | 16.8 /100 | #211 | Poor 13.1% |
| Senegalese | 16.4 /100 | #212 | Poor 13.1% |
| Italians | 15.9 /100 | #213 | Poor 13.1% |
| Zimbabweans | 14.9 /100 | #214 | Poor 13.1% |
Demographics Similar to Puget Sound Salish by Single Male Poverty
In terms of single male poverty, the demographic groups most similar to Puget Sound Salish are Guyanese (12.8%, a difference of 0.12%), South African (12.8%, a difference of 0.15%), Danish (12.8%, a difference of 0.15%), Immigrants from Barbados (12.7%, a difference of 0.18%), and Immigrants from St. Vincent and the Grenadines (12.8%, a difference of 0.18%).
| Demographics | Rating | Rank | Single Male Poverty |
| Eastern Europeans | 63.3 /100 | #162 | Good 12.7% |
| Palestinians | 63.1 /100 | #163 | Good 12.7% |
| Immigrants | Nigeria | 62.8 /100 | #164 | Good 12.7% |
| Immigrants | Cambodia | 62.2 /100 | #165 | Good 12.7% |
| Immigrants | Guyana | 60.5 /100 | #166 | Good 12.7% |
| Immigrants | Sudan | 58.2 /100 | #167 | Average 12.7% |
| Immigrants | Barbados | 57.7 /100 | #168 | Average 12.7% |
| Puget Sound Salish | 54.3 /100 | #169 | Average 12.8% |
| Guyanese | 52.0 /100 | #170 | Average 12.8% |
| South Africans | 51.5 /100 | #171 | Average 12.8% |
| Danes | 51.4 /100 | #172 | Average 12.8% |
| Immigrants | St. Vincent and the Grenadines | 50.9 /100 | #173 | Average 12.8% |
| Costa Ricans | 50.0 /100 | #174 | Average 12.8% |
| Croatians | 48.9 /100 | #175 | Average 12.8% |
| Syrians | 48.4 /100 | #176 | Average 12.8% |