Slavic vs Puget Sound Salish Single Male Poverty
COMPARE
Slavic
Puget Sound Salish
Single Male Poverty
Single Male Poverty Comparison
Slavs
Puget Sound Salish
13.3%
SINGLE MALE POVERTY
5.3/ 100
METRIC RATING
231st/ 347
METRIC RANK
12.8%
SINGLE MALE POVERTY
54.3/ 100
METRIC RATING
169th/ 347
METRIC RANK
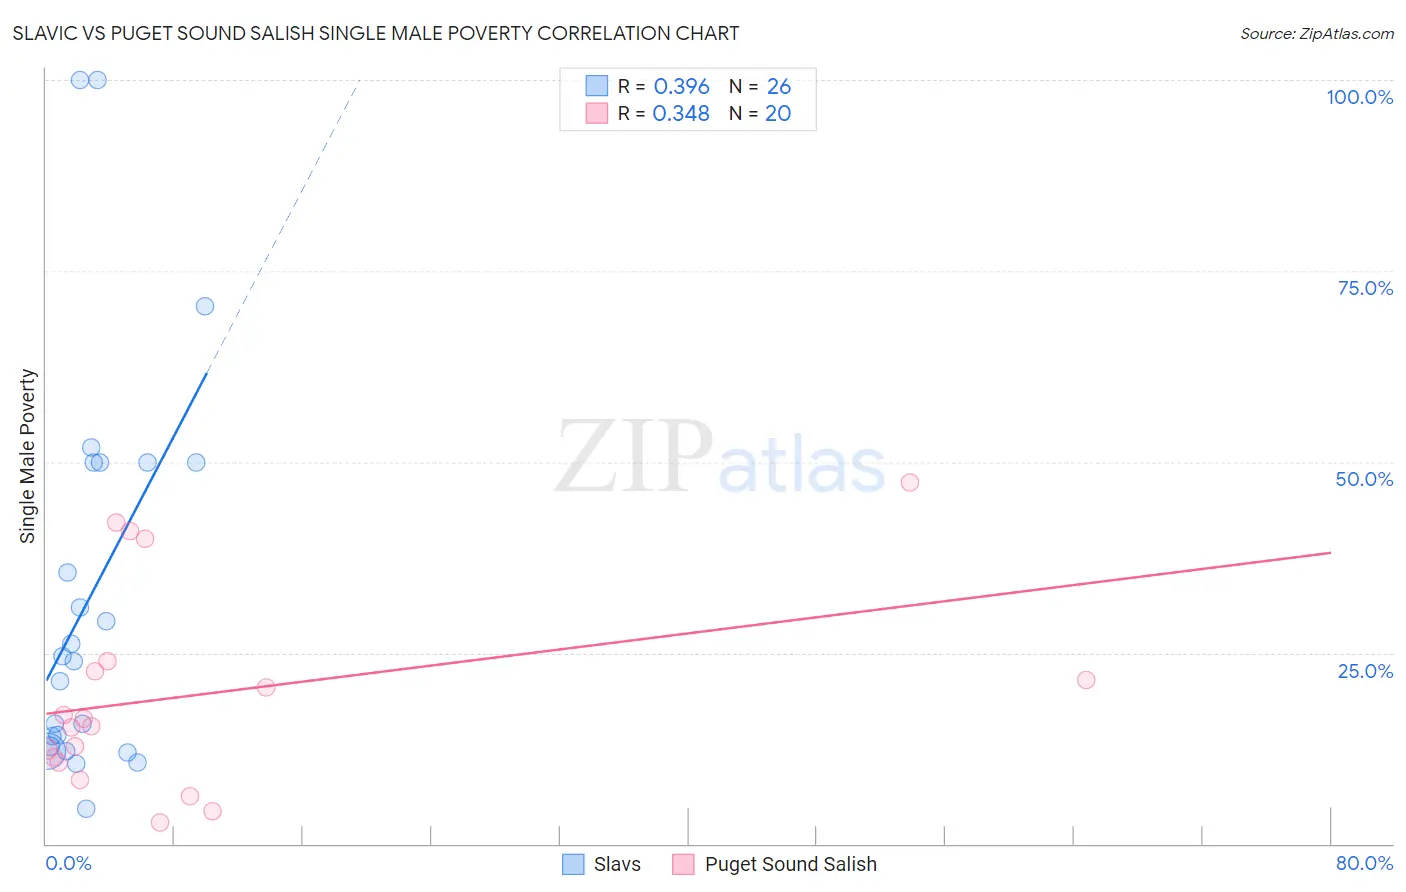
Slavic vs Puget Sound Salish Single Male Poverty Correlation Chart
The statistical analysis conducted on geographies consisting of 243,137,231 people shows a mild positive correlation between the proportion of Slavs and poverty level among single males in the United States with a correlation coefficient (R) of 0.396 and weighted average of 13.3%. Similarly, the statistical analysis conducted on geographies consisting of 44,306,636 people shows a mild positive correlation between the proportion of Puget Sound Salish and poverty level among single males in the United States with a correlation coefficient (R) of 0.348 and weighted average of 12.8%, a difference of 4.0%.
Single Male Poverty Correlation Summary
| Measurement | Slavic | Puget Sound Salish |
| Minimum | 4.5% | 2.8% |
| Maximum | 100.0% | 47.4% |
| Range | 95.5% | 44.6% |
| Mean | 32.6% | 19.6% |
| Median | 24.2% | 15.9% |
| Interquartile 25% (IQ1) | 12.8% | 10.9% |
| Interquartile 75% (IQ3) | 50.0% | 23.3% |
| Interquartile Range (IQR) | 37.2% | 12.4% |
| Standard Deviation (Sample) | 26.2% | 13.2% |
| Standard Deviation (Population) | 25.6% | 12.9% |
Similar Demographics by Single Male Poverty
Demographics Similar to Slavs by Single Male Poverty
In terms of single male poverty, the demographic groups most similar to Slavs are Immigrants from Caribbean (13.3%, a difference of 0.090%), Ghanaian (13.3%, a difference of 0.18%), European (13.3%, a difference of 0.20%), Lebanese (13.2%, a difference of 0.30%), and Haitian (13.2%, a difference of 0.38%).
| Demographics | Rating | Rank | Single Male Poverty |
| Somalis | 9.1 /100 | #224 | Tragic 13.2% |
| Immigrants | Denmark | 8.7 /100 | #225 | Tragic 13.2% |
| Jamaicans | 7.7 /100 | #226 | Tragic 13.2% |
| Haitians | 7.0 /100 | #227 | Tragic 13.2% |
| Lebanese | 6.6 /100 | #228 | Tragic 13.2% |
| Europeans | 6.2 /100 | #229 | Tragic 13.3% |
| Ghanaians | 6.1 /100 | #230 | Tragic 13.3% |
| Slavs | 5.3 /100 | #231 | Tragic 13.3% |
| Immigrants | Caribbean | 5.0 /100 | #232 | Tragic 13.3% |
| British | 4.0 /100 | #233 | Tragic 13.3% |
| Canadians | 4.0 /100 | #234 | Tragic 13.3% |
| Bangladeshis | 3.7 /100 | #235 | Tragic 13.3% |
| Luxembourgers | 3.6 /100 | #236 | Tragic 13.4% |
| British West Indians | 3.4 /100 | #237 | Tragic 13.4% |
| Immigrants | Ghana | 3.2 /100 | #238 | Tragic 13.4% |
Demographics Similar to Puget Sound Salish by Single Male Poverty
In terms of single male poverty, the demographic groups most similar to Puget Sound Salish are Guyanese (12.8%, a difference of 0.12%), South African (12.8%, a difference of 0.15%), Danish (12.8%, a difference of 0.15%), Immigrants from Barbados (12.7%, a difference of 0.18%), and Immigrants from St. Vincent and the Grenadines (12.8%, a difference of 0.18%).
| Demographics | Rating | Rank | Single Male Poverty |
| Eastern Europeans | 63.3 /100 | #162 | Good 12.7% |
| Palestinians | 63.1 /100 | #163 | Good 12.7% |
| Immigrants | Nigeria | 62.8 /100 | #164 | Good 12.7% |
| Immigrants | Cambodia | 62.2 /100 | #165 | Good 12.7% |
| Immigrants | Guyana | 60.5 /100 | #166 | Good 12.7% |
| Immigrants | Sudan | 58.2 /100 | #167 | Average 12.7% |
| Immigrants | Barbados | 57.7 /100 | #168 | Average 12.7% |
| Puget Sound Salish | 54.3 /100 | #169 | Average 12.8% |
| Guyanese | 52.0 /100 | #170 | Average 12.8% |
| South Africans | 51.5 /100 | #171 | Average 12.8% |
| Danes | 51.4 /100 | #172 | Average 12.8% |
| Immigrants | St. Vincent and the Grenadines | 50.9 /100 | #173 | Average 12.8% |
| Costa Ricans | 50.0 /100 | #174 | Average 12.8% |
| Croatians | 48.9 /100 | #175 | Average 12.8% |
| Syrians | 48.4 /100 | #176 | Average 12.8% |