Icelander vs Immigrants from Latvia Single Male Poverty
COMPARE
Icelander
Immigrants from Latvia
Single Male Poverty
Single Male Poverty Comparison
Icelanders
Immigrants from Latvia
12.5%
SINGLE MALE POVERTY
88.2/ 100
METRIC RATING
121st/ 347
METRIC RANK
12.2%
SINGLE MALE POVERTY
97.0/ 100
METRIC RATING
101st/ 347
METRIC RANK
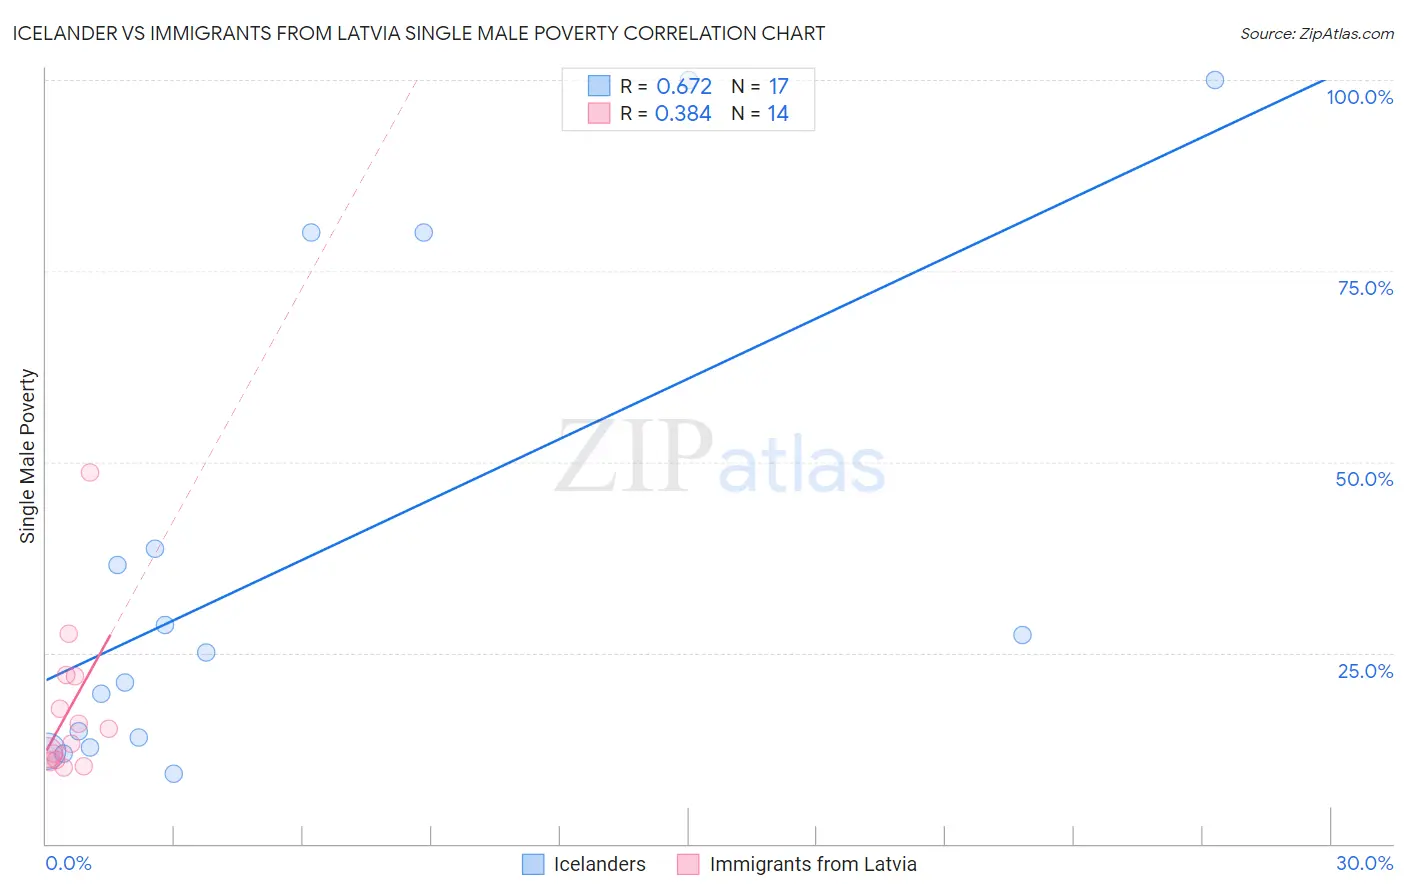
Icelander vs Immigrants from Latvia Single Male Poverty Correlation Chart
The statistical analysis conducted on geographies consisting of 148,220,666 people shows a significant positive correlation between the proportion of Icelanders and poverty level among single males in the United States with a correlation coefficient (R) of 0.672 and weighted average of 12.5%. Similarly, the statistical analysis conducted on geographies consisting of 106,119,330 people shows a mild positive correlation between the proportion of Immigrants from Latvia and poverty level among single males in the United States with a correlation coefficient (R) of 0.384 and weighted average of 12.2%, a difference of 2.0%.
Single Male Poverty Correlation Summary
| Measurement | Icelander | Immigrants from Latvia |
| Minimum | 9.1% | 9.9% |
| Maximum | 100.0% | 48.6% |
| Range | 90.9% | 38.7% |
| Mean | 37.1% | 17.7% |
| Median | 25.0% | 14.1% |
| Interquartile 25% (IQ1) | 13.3% | 11.0% |
| Interquartile 75% (IQ3) | 59.3% | 22.0% |
| Interquartile Range (IQR) | 46.1% | 11.0% |
| Standard Deviation (Sample) | 31.8% | 10.4% |
| Standard Deviation (Population) | 30.8% | 10.0% |
Demographics Similar to Icelanders and Immigrants from Latvia by Single Male Poverty
In terms of single male poverty, the demographic groups most similar to Icelanders are Venezuelan (12.4%, a difference of 0.16%), Immigrants from Albania (12.4%, a difference of 0.30%), Albanian (12.4%, a difference of 0.33%), Immigrants from Oceania (12.4%, a difference of 0.43%), and Immigrants from Syria (12.4%, a difference of 0.44%). Similarly, the demographic groups most similar to Immigrants from Latvia are Immigrants from Europe (12.2%, a difference of 0.010%), Immigrants from Armenia (12.2%, a difference of 0.15%), Immigrants from Kazakhstan (12.2%, a difference of 0.15%), Jordanian (12.3%, a difference of 0.47%), and Immigrants from Morocco (12.3%, a difference of 0.55%).
| Demographics | Rating | Rank | Single Male Poverty |
| Immigrants | Latvia | 97.0 /100 | #101 | Exceptional 12.2% |
| Immigrants | Europe | 97.0 /100 | #102 | Exceptional 12.2% |
| Immigrants | Armenia | 96.7 /100 | #103 | Exceptional 12.2% |
| Immigrants | Kazakhstan | 96.7 /100 | #104 | Exceptional 12.2% |
| Jordanians | 95.9 /100 | #105 | Exceptional 12.3% |
| Immigrants | Morocco | 95.6 /100 | #106 | Exceptional 12.3% |
| Iraqis | 95.1 /100 | #107 | Exceptional 12.3% |
| Immigrants | Eastern Africa | 95.0 /100 | #108 | Exceptional 12.3% |
| Ugandans | 94.5 /100 | #109 | Exceptional 12.3% |
| Immigrants | Portugal | 93.6 /100 | #110 | Exceptional 12.3% |
| Immigrants | North Macedonia | 93.6 /100 | #111 | Exceptional 12.3% |
| Kenyans | 93.3 /100 | #112 | Exceptional 12.4% |
| Pakistanis | 92.4 /100 | #113 | Exceptional 12.4% |
| Nicaraguans | 92.1 /100 | #114 | Exceptional 12.4% |
| Immigrants | Southern Europe | 91.5 /100 | #115 | Exceptional 12.4% |
| Immigrants | Syria | 91.2 /100 | #116 | Exceptional 12.4% |
| Immigrants | Oceania | 91.1 /100 | #117 | Exceptional 12.4% |
| Albanians | 90.6 /100 | #118 | Exceptional 12.4% |
| Immigrants | Albania | 90.3 /100 | #119 | Exceptional 12.4% |
| Venezuelans | 89.4 /100 | #120 | Excellent 12.4% |
| Icelanders | 88.2 /100 | #121 | Excellent 12.5% |