Afghan vs Puget Sound Salish Single Male Poverty
COMPARE
Afghan
Puget Sound Salish
Single Male Poverty
Single Male Poverty Comparison
Afghans
Puget Sound Salish
10.7%
SINGLE MALE POVERTY
100.0/ 100
METRIC RATING
7th/ 347
METRIC RANK
12.8%
SINGLE MALE POVERTY
54.3/ 100
METRIC RATING
169th/ 347
METRIC RANK
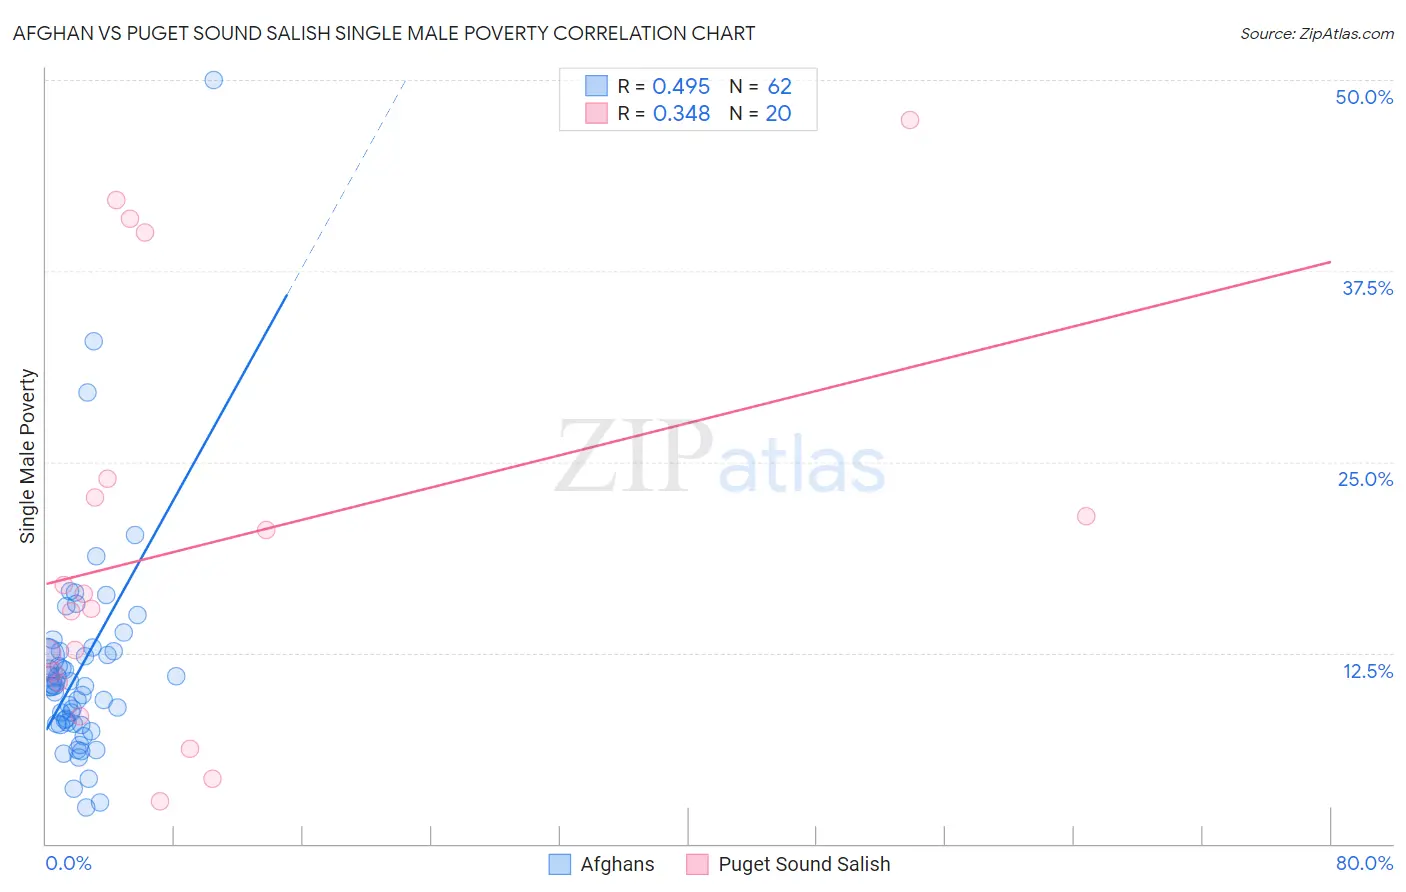
Afghan vs Puget Sound Salish Single Male Poverty Correlation Chart
The statistical analysis conducted on geographies consisting of 140,679,200 people shows a moderate positive correlation between the proportion of Afghans and poverty level among single males in the United States with a correlation coefficient (R) of 0.495 and weighted average of 10.7%. Similarly, the statistical analysis conducted on geographies consisting of 44,306,636 people shows a mild positive correlation between the proportion of Puget Sound Salish and poverty level among single males in the United States with a correlation coefficient (R) of 0.348 and weighted average of 12.8%, a difference of 19.3%.
Single Male Poverty Correlation Summary
| Measurement | Afghan | Puget Sound Salish |
| Minimum | 2.4% | 2.8% |
| Maximum | 50.0% | 47.4% |
| Range | 47.6% | 44.6% |
| Mean | 11.5% | 19.6% |
| Median | 10.3% | 15.9% |
| Interquartile 25% (IQ1) | 7.8% | 10.9% |
| Interquartile 75% (IQ3) | 12.6% | 23.3% |
| Interquartile Range (IQR) | 4.8% | 12.4% |
| Standard Deviation (Sample) | 7.2% | 13.2% |
| Standard Deviation (Population) | 7.2% | 12.9% |
Similar Demographics by Single Male Poverty
Demographics Similar to Afghans by Single Male Poverty
In terms of single male poverty, the demographic groups most similar to Afghans are Thai (10.8%, a difference of 0.47%), Filipino (10.6%, a difference of 0.75%), Taiwanese (10.9%, a difference of 1.7%), Immigrants from Fiji (10.9%, a difference of 1.8%), and Immigrants from Philippines (10.9%, a difference of 1.8%).
| Demographics | Rating | Rank | Single Male Poverty |
| Assyrians/Chaldeans/Syriacs | 100.0 /100 | #1 | Exceptional 9.8% |
| Immigrants | Taiwan | 100.0 /100 | #2 | Exceptional 10.3% |
| Immigrants | India | 100.0 /100 | #3 | Exceptional 10.3% |
| Immigrants | Hong Kong | 100.0 /100 | #4 | Exceptional 10.4% |
| Tongans | 100.0 /100 | #5 | Exceptional 10.5% |
| Filipinos | 100.0 /100 | #6 | Exceptional 10.6% |
| Afghans | 100.0 /100 | #7 | Exceptional 10.7% |
| Thais | 100.0 /100 | #8 | Exceptional 10.8% |
| Taiwanese | 100.0 /100 | #9 | Exceptional 10.9% |
| Immigrants | Fiji | 100.0 /100 | #10 | Exceptional 10.9% |
| Immigrants | Philippines | 100.0 /100 | #11 | Exceptional 10.9% |
| Immigrants | Afghanistan | 100.0 /100 | #12 | Exceptional 10.9% |
| Immigrants | South Central Asia | 100.0 /100 | #13 | Exceptional 10.9% |
| Chinese | 100.0 /100 | #14 | Exceptional 11.0% |
| Koreans | 100.0 /100 | #15 | Exceptional 11.0% |
Demographics Similar to Puget Sound Salish by Single Male Poverty
In terms of single male poverty, the demographic groups most similar to Puget Sound Salish are Guyanese (12.8%, a difference of 0.12%), South African (12.8%, a difference of 0.15%), Danish (12.8%, a difference of 0.15%), Immigrants from Barbados (12.7%, a difference of 0.18%), and Immigrants from St. Vincent and the Grenadines (12.8%, a difference of 0.18%).
| Demographics | Rating | Rank | Single Male Poverty |
| Eastern Europeans | 63.3 /100 | #162 | Good 12.7% |
| Palestinians | 63.1 /100 | #163 | Good 12.7% |
| Immigrants | Nigeria | 62.8 /100 | #164 | Good 12.7% |
| Immigrants | Cambodia | 62.2 /100 | #165 | Good 12.7% |
| Immigrants | Guyana | 60.5 /100 | #166 | Good 12.7% |
| Immigrants | Sudan | 58.2 /100 | #167 | Average 12.7% |
| Immigrants | Barbados | 57.7 /100 | #168 | Average 12.7% |
| Puget Sound Salish | 54.3 /100 | #169 | Average 12.8% |
| Guyanese | 52.0 /100 | #170 | Average 12.8% |
| South Africans | 51.5 /100 | #171 | Average 12.8% |
| Danes | 51.4 /100 | #172 | Average 12.8% |
| Immigrants | St. Vincent and the Grenadines | 50.9 /100 | #173 | Average 12.8% |
| Costa Ricans | 50.0 /100 | #174 | Average 12.8% |
| Croatians | 48.9 /100 | #175 | Average 12.8% |
| Syrians | 48.4 /100 | #176 | Average 12.8% |