Icelander vs Puget Sound Salish Median Earnings
COMPARE
Icelander
Puget Sound Salish
Median Earnings
Median Earnings Comparison
Icelanders
Puget Sound Salish
$46,916
MEDIAN EARNINGS
66.3/ 100
METRIC RATING
163rd/ 347
METRIC RANK
$46,333
MEDIAN EARNINGS
46.5/ 100
METRIC RATING
180th/ 347
METRIC RANK
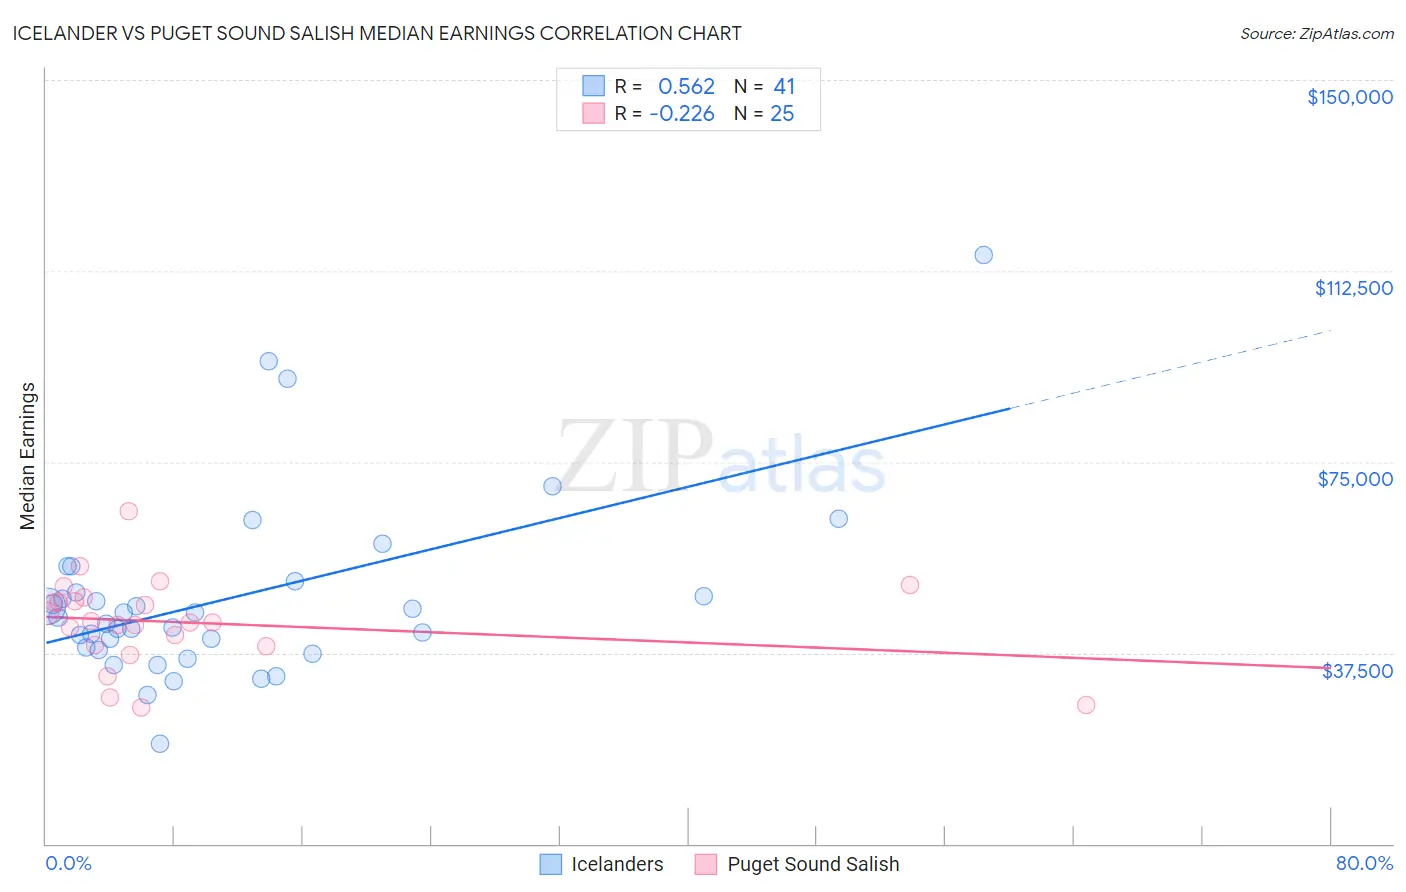
Icelander vs Puget Sound Salish Median Earnings Correlation Chart
The statistical analysis conducted on geographies consisting of 159,666,599 people shows a substantial positive correlation between the proportion of Icelanders and median earnings in the United States with a correlation coefficient (R) of 0.562 and weighted average of $46,916. Similarly, the statistical analysis conducted on geographies consisting of 46,155,746 people shows a weak negative correlation between the proportion of Puget Sound Salish and median earnings in the United States with a correlation coefficient (R) of -0.226 and weighted average of $46,333, a difference of 1.3%.
Median Earnings Correlation Summary
| Measurement | Icelander | Puget Sound Salish |
| Minimum | $19,583 | $26,875 |
| Maximum | $115,625 | $65,298 |
| Range | $96,042 | $38,423 |
| Mean | $48,186 | $43,450 |
| Median | $44,536 | $43,514 |
| Interquartile 25% (IQ1) | $38,407 | $38,912 |
| Interquartile 75% (IQ3) | $50,498 | $47,991 |
| Interquartile Range (IQR) | $12,091 | $9,079 |
| Standard Deviation (Sample) | $17,953 | $8,689 |
| Standard Deviation (Population) | $17,732 | $8,513 |
Demographics Similar to Icelanders and Puget Sound Salish by Median Earnings
In terms of median earnings, the demographic groups most similar to Icelanders are South American Indian ($46,952, a difference of 0.080%), Immigrants from Eastern Africa ($46,969, a difference of 0.11%), Norwegian ($46,865, a difference of 0.11%), South American ($46,804, a difference of 0.24%), and Czechoslovakian ($46,658, a difference of 0.55%). Similarly, the demographic groups most similar to Puget Sound Salish are English ($46,334, a difference of 0.0%), Immigrants from Cameroon ($46,329, a difference of 0.010%), Colombian ($46,349, a difference of 0.040%), Belgian ($46,375, a difference of 0.090%), and Danish ($46,392, a difference of 0.13%).
| Demographics | Rating | Rank | Median Earnings |
| Immigrants | Eastern Africa | 68.0 /100 | #161 | Good $46,969 |
| South American Indians | 67.4 /100 | #162 | Good $46,952 |
| Icelanders | 66.3 /100 | #163 | Good $46,916 |
| Norwegians | 64.7 /100 | #164 | Good $46,865 |
| South Americans | 62.7 /100 | #165 | Good $46,804 |
| Czechoslovakians | 57.8 /100 | #166 | Average $46,658 |
| Costa Ricans | 57.4 /100 | #167 | Average $46,645 |
| Immigrants | Africa | 54.6 /100 | #168 | Average $46,564 |
| Immigrants | South America | 54.0 /100 | #169 | Average $46,548 |
| Immigrants | Immigrants | 51.6 /100 | #170 | Average $46,478 |
| Scottish | 51.1 /100 | #171 | Average $46,463 |
| Kenyans | 51.0 /100 | #172 | Average $46,462 |
| Ghanaians | 50.3 /100 | #173 | Average $46,440 |
| Scandinavians | 50.0 /100 | #174 | Average $46,433 |
| Basques | 48.8 /100 | #175 | Average $46,399 |
| Danes | 48.6 /100 | #176 | Average $46,392 |
| Belgians | 48.0 /100 | #177 | Average $46,375 |
| Colombians | 47.1 /100 | #178 | Average $46,349 |
| English | 46.5 /100 | #179 | Average $46,334 |
| Puget Sound Salish | 46.5 /100 | #180 | Average $46,333 |
| Immigrants | Cameroon | 46.4 /100 | #181 | Average $46,329 |