Alsatian vs Puget Sound Salish Single Male Poverty
COMPARE
Alsatian
Puget Sound Salish
Single Male Poverty
Single Male Poverty Comparison
Alsatians
Puget Sound Salish
15.2%
SINGLE MALE POVERTY
0.0/ 100
METRIC RATING
302nd/ 347
METRIC RANK
12.8%
SINGLE MALE POVERTY
54.3/ 100
METRIC RATING
169th/ 347
METRIC RANK
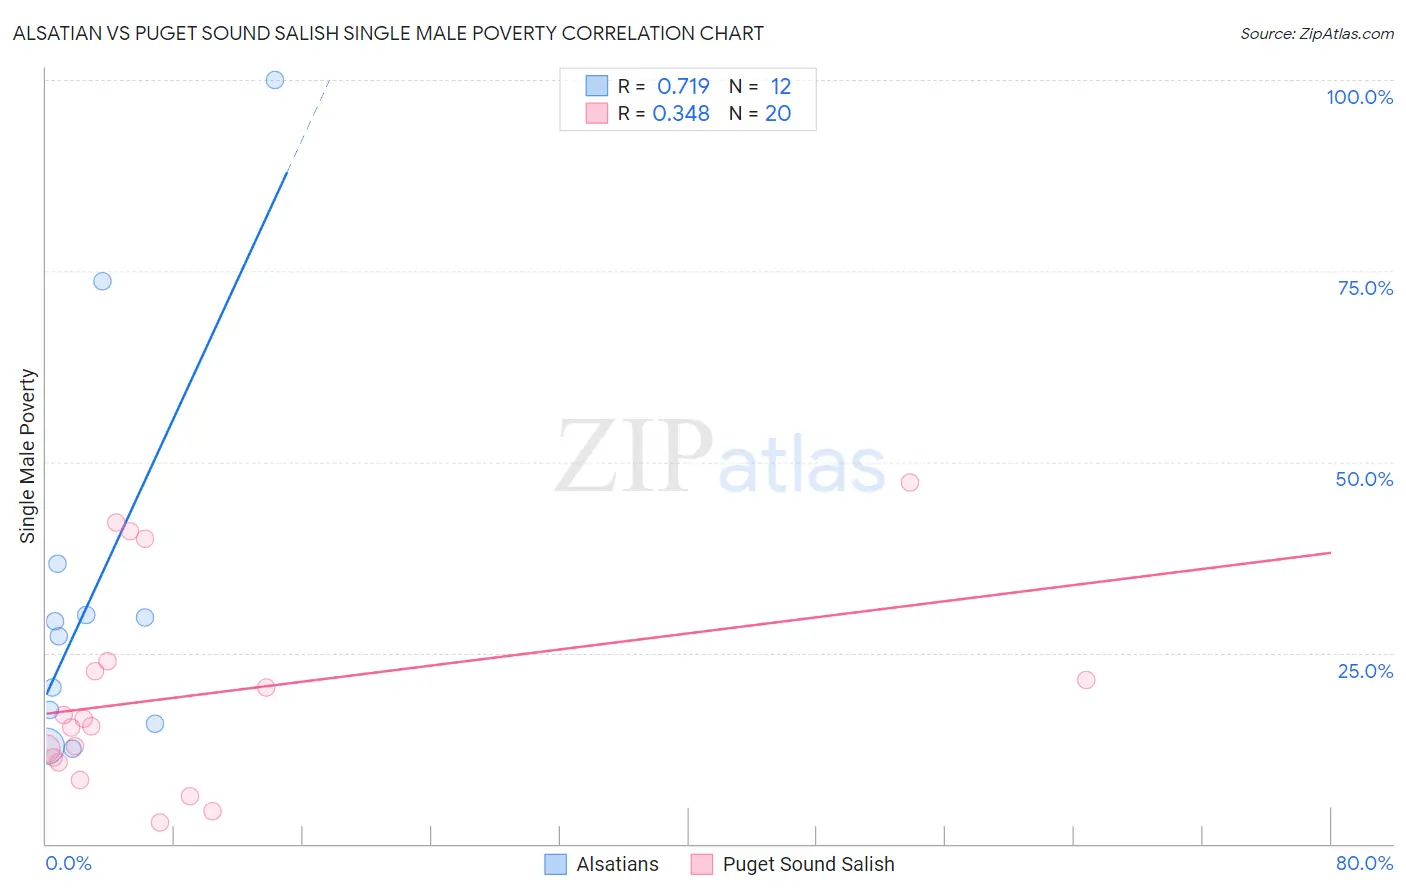
Alsatian vs Puget Sound Salish Single Male Poverty Correlation Chart
The statistical analysis conducted on geographies consisting of 78,244,917 people shows a strong positive correlation between the proportion of Alsatians and poverty level among single males in the United States with a correlation coefficient (R) of 0.719 and weighted average of 15.2%. Similarly, the statistical analysis conducted on geographies consisting of 44,306,636 people shows a mild positive correlation between the proportion of Puget Sound Salish and poverty level among single males in the United States with a correlation coefficient (R) of 0.348 and weighted average of 12.8%, a difference of 19.4%.
Single Male Poverty Correlation Summary
| Measurement | Alsatian | Puget Sound Salish |
| Minimum | 12.5% | 2.8% |
| Maximum | 100.0% | 47.4% |
| Range | 87.5% | 44.6% |
| Mean | 33.8% | 19.6% |
| Median | 28.1% | 15.9% |
| Interquartile 25% (IQ1) | 16.6% | 10.9% |
| Interquartile 75% (IQ3) | 33.3% | 23.3% |
| Interquartile Range (IQR) | 16.7% | 12.4% |
| Standard Deviation (Sample) | 26.5% | 13.2% |
| Standard Deviation (Population) | 25.4% | 12.9% |
Similar Demographics by Single Male Poverty
Demographics Similar to Alsatians by Single Male Poverty
In terms of single male poverty, the demographic groups most similar to Alsatians are Dominican (15.2%, a difference of 0.16%), Cree (15.1%, a difference of 0.98%), Aleut (15.4%, a difference of 1.0%), Alaska Native (15.4%, a difference of 1.1%), and Delaware (15.0%, a difference of 1.4%).
| Demographics | Rating | Rank | Single Male Poverty |
| Scotch-Irish | 0.0 /100 | #295 | Tragic 14.7% |
| Africans | 0.0 /100 | #296 | Tragic 14.7% |
| Immigrants | Dominican Republic | 0.0 /100 | #297 | Tragic 14.8% |
| French American Indians | 0.0 /100 | #298 | Tragic 15.0% |
| Delaware | 0.0 /100 | #299 | Tragic 15.0% |
| Cree | 0.0 /100 | #300 | Tragic 15.1% |
| Dominicans | 0.0 /100 | #301 | Tragic 15.2% |
| Alsatians | 0.0 /100 | #302 | Tragic 15.2% |
| Aleuts | 0.0 /100 | #303 | Tragic 15.4% |
| Alaska Natives | 0.0 /100 | #304 | Tragic 15.4% |
| Blackfeet | 0.0 /100 | #305 | Tragic 15.5% |
| Pennsylvania Germans | 0.0 /100 | #306 | Tragic 15.6% |
| Ute | 0.0 /100 | #307 | Tragic 15.7% |
| Potawatomi | 0.0 /100 | #308 | Tragic 15.8% |
| Americans | 0.0 /100 | #309 | Tragic 15.8% |
Demographics Similar to Puget Sound Salish by Single Male Poverty
In terms of single male poverty, the demographic groups most similar to Puget Sound Salish are Guyanese (12.8%, a difference of 0.12%), South African (12.8%, a difference of 0.15%), Danish (12.8%, a difference of 0.15%), Immigrants from Barbados (12.7%, a difference of 0.18%), and Immigrants from St. Vincent and the Grenadines (12.8%, a difference of 0.18%).
| Demographics | Rating | Rank | Single Male Poverty |
| Eastern Europeans | 63.3 /100 | #162 | Good 12.7% |
| Palestinians | 63.1 /100 | #163 | Good 12.7% |
| Immigrants | Nigeria | 62.8 /100 | #164 | Good 12.7% |
| Immigrants | Cambodia | 62.2 /100 | #165 | Good 12.7% |
| Immigrants | Guyana | 60.5 /100 | #166 | Good 12.7% |
| Immigrants | Sudan | 58.2 /100 | #167 | Average 12.7% |
| Immigrants | Barbados | 57.7 /100 | #168 | Average 12.7% |
| Puget Sound Salish | 54.3 /100 | #169 | Average 12.8% |
| Guyanese | 52.0 /100 | #170 | Average 12.8% |
| South Africans | 51.5 /100 | #171 | Average 12.8% |
| Danes | 51.4 /100 | #172 | Average 12.8% |
| Immigrants | St. Vincent and the Grenadines | 50.9 /100 | #173 | Average 12.8% |
| Costa Ricans | 50.0 /100 | #174 | Average 12.8% |
| Croatians | 48.9 /100 | #175 | Average 12.8% |
| Syrians | 48.4 /100 | #176 | Average 12.8% |