Icelander vs Uruguayan Single Male Poverty
COMPARE
Icelander
Uruguayan
Single Male Poverty
Single Male Poverty Comparison
Icelanders
Uruguayans
12.5%
SINGLE MALE POVERTY
88.2/ 100
METRIC RATING
121st/ 347
METRIC RANK
11.9%
SINGLE MALE POVERTY
99.4/ 100
METRIC RATING
75th/ 347
METRIC RANK
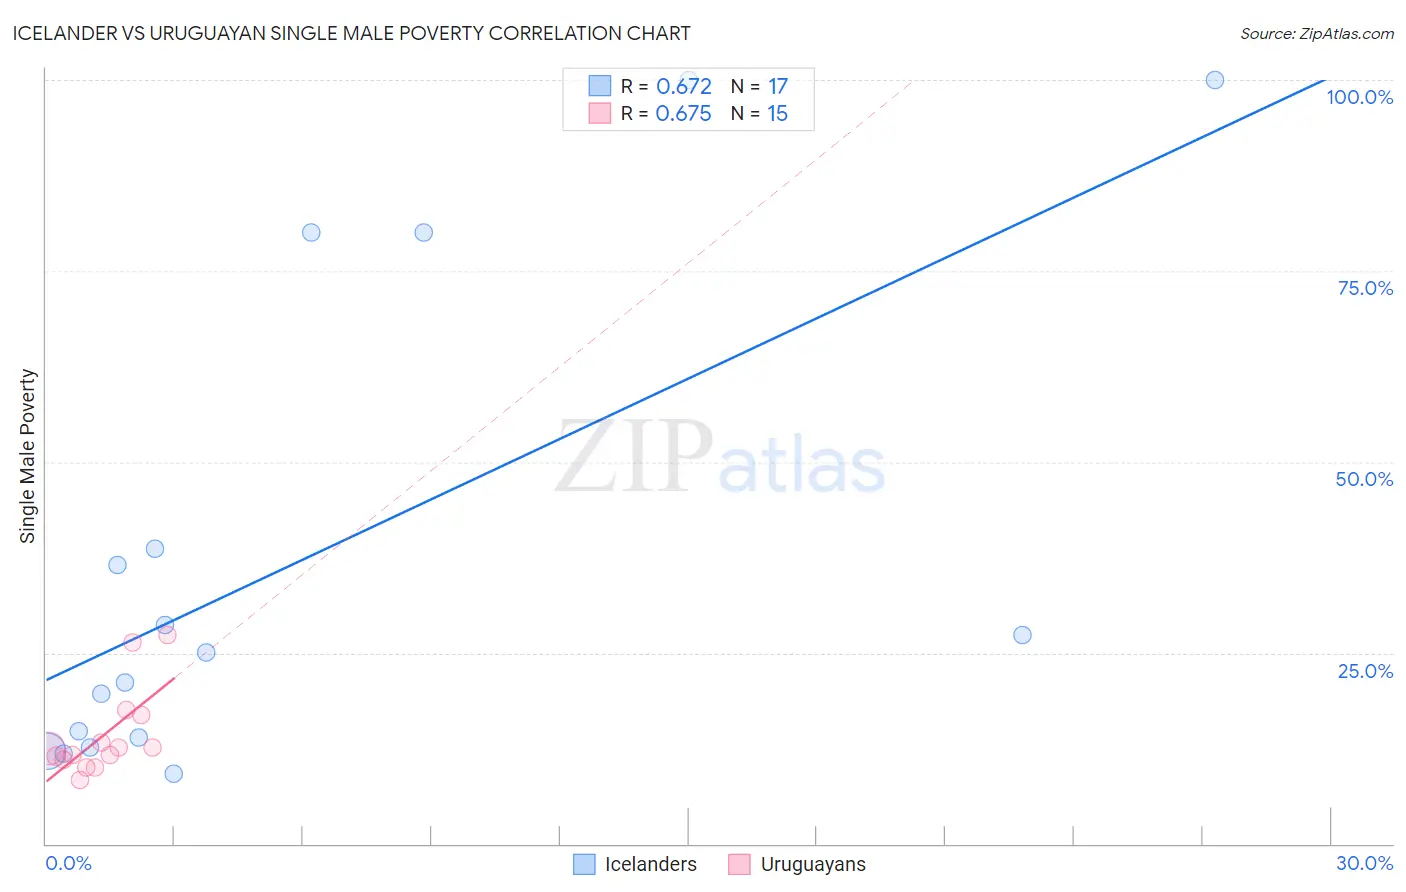
Icelander vs Uruguayan Single Male Poverty Correlation Chart
The statistical analysis conducted on geographies consisting of 148,220,666 people shows a significant positive correlation between the proportion of Icelanders and poverty level among single males in the United States with a correlation coefficient (R) of 0.672 and weighted average of 12.5%. Similarly, the statistical analysis conducted on geographies consisting of 136,478,006 people shows a significant positive correlation between the proportion of Uruguayans and poverty level among single males in the United States with a correlation coefficient (R) of 0.675 and weighted average of 11.9%, a difference of 4.3%.
Single Male Poverty Correlation Summary
| Measurement | Icelander | Uruguayan |
| Minimum | 9.1% | 8.4% |
| Maximum | 100.0% | 27.3% |
| Range | 90.9% | 18.9% |
| Mean | 37.1% | 14.2% |
| Median | 25.0% | 12.4% |
| Interquartile 25% (IQ1) | 13.3% | 11.0% |
| Interquartile 75% (IQ3) | 59.3% | 16.9% |
| Interquartile Range (IQR) | 46.1% | 5.9% |
| Standard Deviation (Sample) | 31.8% | 5.7% |
| Standard Deviation (Population) | 30.8% | 5.5% |
Similar Demographics by Single Male Poverty
Demographics Similar to Icelanders by Single Male Poverty
In terms of single male poverty, the demographic groups most similar to Icelanders are Serbian (12.5%, a difference of 0.050%), Immigrants from Kenya (12.5%, a difference of 0.090%), Russian (12.5%, a difference of 0.12%), Immigrants from Jordan (12.5%, a difference of 0.15%), and Venezuelan (12.4%, a difference of 0.16%).
| Demographics | Rating | Rank | Single Male Poverty |
| Nicaraguans | 92.1 /100 | #114 | Exceptional 12.4% |
| Immigrants | Southern Europe | 91.5 /100 | #115 | Exceptional 12.4% |
| Immigrants | Syria | 91.2 /100 | #116 | Exceptional 12.4% |
| Immigrants | Oceania | 91.1 /100 | #117 | Exceptional 12.4% |
| Albanians | 90.6 /100 | #118 | Exceptional 12.4% |
| Immigrants | Albania | 90.3 /100 | #119 | Exceptional 12.4% |
| Venezuelans | 89.4 /100 | #120 | Excellent 12.4% |
| Icelanders | 88.2 /100 | #121 | Excellent 12.5% |
| Serbians | 87.9 /100 | #122 | Excellent 12.5% |
| Immigrants | Kenya | 87.6 /100 | #123 | Excellent 12.5% |
| Russians | 87.3 /100 | #124 | Excellent 12.5% |
| Immigrants | Jordan | 87.1 /100 | #125 | Excellent 12.5% |
| Romanians | 86.4 /100 | #126 | Excellent 12.5% |
| Immigrants | Netherlands | 86.2 /100 | #127 | Excellent 12.5% |
| Ecuadorians | 85.9 /100 | #128 | Excellent 12.5% |
Demographics Similar to Uruguayans by Single Male Poverty
In terms of single male poverty, the demographic groups most similar to Uruguayans are Immigrants from Northern Africa (11.9%, a difference of 0.020%), Chilean (11.9%, a difference of 0.19%), Argentinean (11.9%, a difference of 0.25%), Immigrants from Malaysia (12.0%, a difference of 0.29%), and Immigrants from Argentina (11.9%, a difference of 0.37%).
| Demographics | Rating | Rank | Single Male Poverty |
| Immigrants | Croatia | 99.6 /100 | #68 | Exceptional 11.9% |
| Immigrants | Russia | 99.6 /100 | #69 | Exceptional 11.9% |
| Immigrants | Nepal | 99.6 /100 | #70 | Exceptional 11.9% |
| Immigrants | Greece | 99.6 /100 | #71 | Exceptional 11.9% |
| Immigrants | Argentina | 99.5 /100 | #72 | Exceptional 11.9% |
| Argentineans | 99.5 /100 | #73 | Exceptional 11.9% |
| Chileans | 99.5 /100 | #74 | Exceptional 11.9% |
| Uruguayans | 99.4 /100 | #75 | Exceptional 11.9% |
| Immigrants | Northern Africa | 99.4 /100 | #76 | Exceptional 11.9% |
| Immigrants | Malaysia | 99.2 /100 | #77 | Exceptional 12.0% |
| Immigrants | Venezuela | 99.1 /100 | #78 | Exceptional 12.0% |
| Immigrants | Belgium | 99.0 /100 | #79 | Exceptional 12.0% |
| Armenians | 98.7 /100 | #80 | Exceptional 12.1% |
| Immigrants | South America | 98.7 /100 | #81 | Exceptional 12.1% |
| Immigrants | Colombia | 98.6 /100 | #82 | Exceptional 12.1% |