Native/Alaskan vs Puget Sound Salish Single Male Poverty
COMPARE
Native/Alaskan
Puget Sound Salish
Single Male Poverty
Single Male Poverty Comparison
Natives/Alaskans
Puget Sound Salish
19.6%
SINGLE MALE POVERTY
0.0/ 100
METRIC RATING
332nd/ 347
METRIC RANK
12.8%
SINGLE MALE POVERTY
54.3/ 100
METRIC RATING
169th/ 347
METRIC RANK
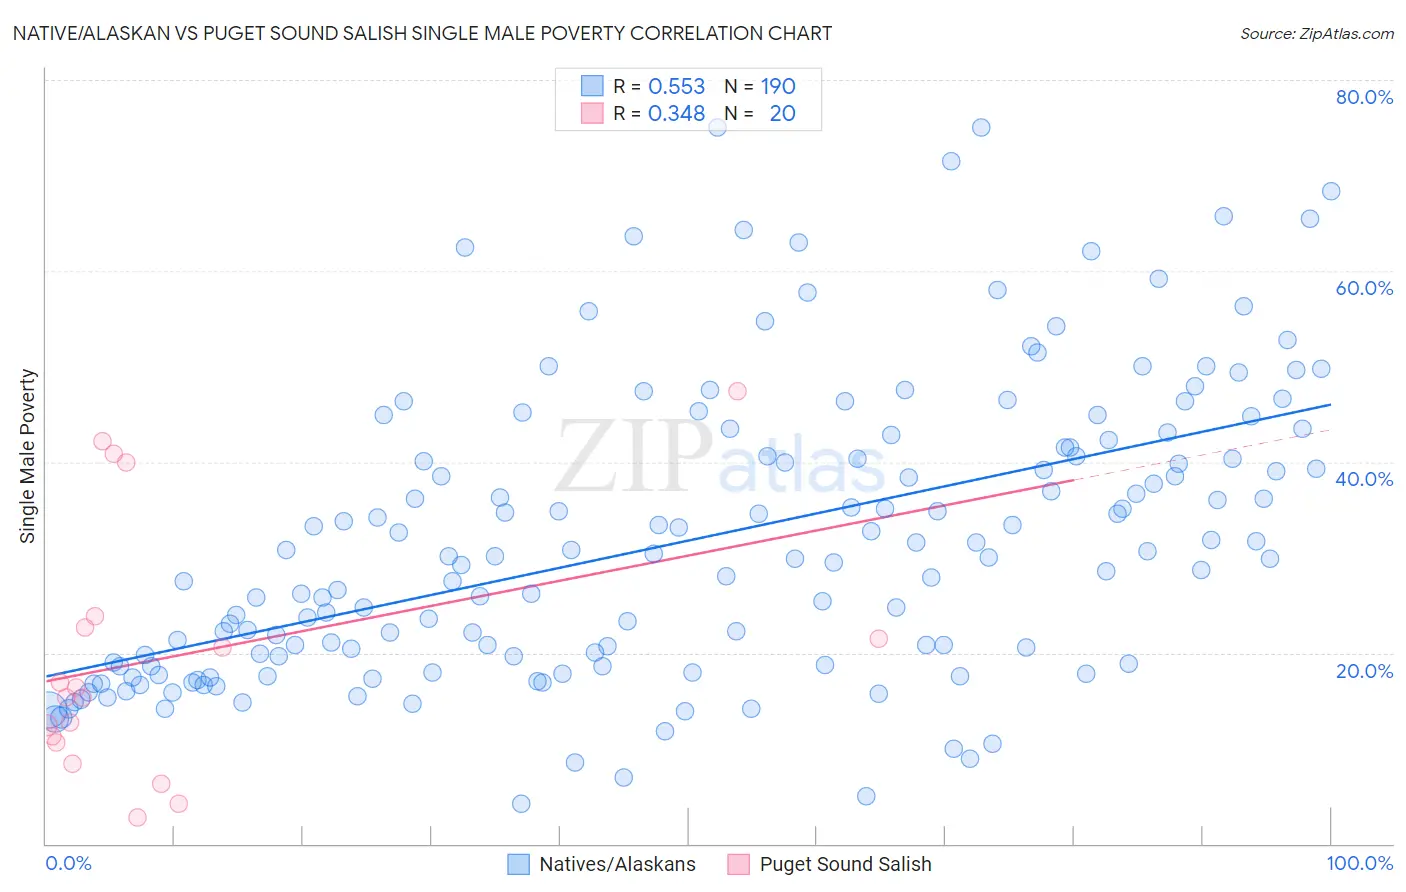
Native/Alaskan vs Puget Sound Salish Single Male Poverty Correlation Chart
The statistical analysis conducted on geographies consisting of 444,255,067 people shows a substantial positive correlation between the proportion of Natives/Alaskans and poverty level among single males in the United States with a correlation coefficient (R) of 0.553 and weighted average of 19.6%. Similarly, the statistical analysis conducted on geographies consisting of 44,306,636 people shows a mild positive correlation between the proportion of Puget Sound Salish and poverty level among single males in the United States with a correlation coefficient (R) of 0.348 and weighted average of 12.8%, a difference of 53.6%.
Single Male Poverty Correlation Summary
| Measurement | Native/Alaskan | Puget Sound Salish |
| Minimum | 4.3% | 2.8% |
| Maximum | 75.0% | 47.4% |
| Range | 70.7% | 44.6% |
| Mean | 31.7% | 19.6% |
| Median | 29.9% | 15.9% |
| Interquartile 25% (IQ1) | 18.7% | 10.9% |
| Interquartile 75% (IQ3) | 41.5% | 23.3% |
| Interquartile Range (IQR) | 22.8% | 12.4% |
| Standard Deviation (Sample) | 15.2% | 13.2% |
| Standard Deviation (Population) | 15.2% | 12.9% |
Similar Demographics by Single Male Poverty
Demographics Similar to Natives/Alaskans by Single Male Poverty
In terms of single male poverty, the demographic groups most similar to Natives/Alaskans are Paiute (19.3%, a difference of 1.7%), Inupiat (20.0%, a difference of 1.9%), Pima (20.2%, a difference of 2.7%), Cajun (19.1%, a difference of 2.8%), and Colville (18.4%, a difference of 6.4%).
| Demographics | Rating | Rank | Single Male Poverty |
| Choctaw | 0.0 /100 | #325 | Tragic 17.0% |
| Central American Indians | 0.0 /100 | #326 | Tragic 17.2% |
| Menominee | 0.0 /100 | #327 | Tragic 17.7% |
| Kiowa | 0.0 /100 | #328 | Tragic 18.3% |
| Colville | 0.0 /100 | #329 | Tragic 18.4% |
| Cajuns | 0.0 /100 | #330 | Tragic 19.1% |
| Paiute | 0.0 /100 | #331 | Tragic 19.3% |
| Natives/Alaskans | 0.0 /100 | #332 | Tragic 19.6% |
| Inupiat | 0.0 /100 | #333 | Tragic 20.0% |
| Pima | 0.0 /100 | #334 | Tragic 20.2% |
| Yuman | 0.0 /100 | #335 | Tragic 21.3% |
| Tohono O'odham | 0.0 /100 | #336 | Tragic 21.6% |
| Apache | 0.0 /100 | #337 | Tragic 21.6% |
| Pueblo | 0.0 /100 | #338 | Tragic 21.6% |
| Arapaho | 0.0 /100 | #339 | Tragic 21.9% |
Demographics Similar to Puget Sound Salish by Single Male Poverty
In terms of single male poverty, the demographic groups most similar to Puget Sound Salish are Guyanese (12.8%, a difference of 0.12%), South African (12.8%, a difference of 0.15%), Danish (12.8%, a difference of 0.15%), Immigrants from Barbados (12.7%, a difference of 0.18%), and Immigrants from St. Vincent and the Grenadines (12.8%, a difference of 0.18%).
| Demographics | Rating | Rank | Single Male Poverty |
| Eastern Europeans | 63.3 /100 | #162 | Good 12.7% |
| Palestinians | 63.1 /100 | #163 | Good 12.7% |
| Immigrants | Nigeria | 62.8 /100 | #164 | Good 12.7% |
| Immigrants | Cambodia | 62.2 /100 | #165 | Good 12.7% |
| Immigrants | Guyana | 60.5 /100 | #166 | Good 12.7% |
| Immigrants | Sudan | 58.2 /100 | #167 | Average 12.7% |
| Immigrants | Barbados | 57.7 /100 | #168 | Average 12.7% |
| Puget Sound Salish | 54.3 /100 | #169 | Average 12.8% |
| Guyanese | 52.0 /100 | #170 | Average 12.8% |
| South Africans | 51.5 /100 | #171 | Average 12.8% |
| Danes | 51.4 /100 | #172 | Average 12.8% |
| Immigrants | St. Vincent and the Grenadines | 50.9 /100 | #173 | Average 12.8% |
| Costa Ricans | 50.0 /100 | #174 | Average 12.8% |
| Croatians | 48.9 /100 | #175 | Average 12.8% |
| Syrians | 48.4 /100 | #176 | Average 12.8% |