Immigrants from Ukraine vs Puget Sound Salish Single Male Poverty
COMPARE
Immigrants from Ukraine
Puget Sound Salish
Single Male Poverty
Single Male Poverty Comparison
Immigrants from Ukraine
Puget Sound Salish
11.9%
SINGLE MALE POVERTY
99.6/ 100
METRIC RATING
67th/ 347
METRIC RANK
12.8%
SINGLE MALE POVERTY
54.3/ 100
METRIC RATING
169th/ 347
METRIC RANK
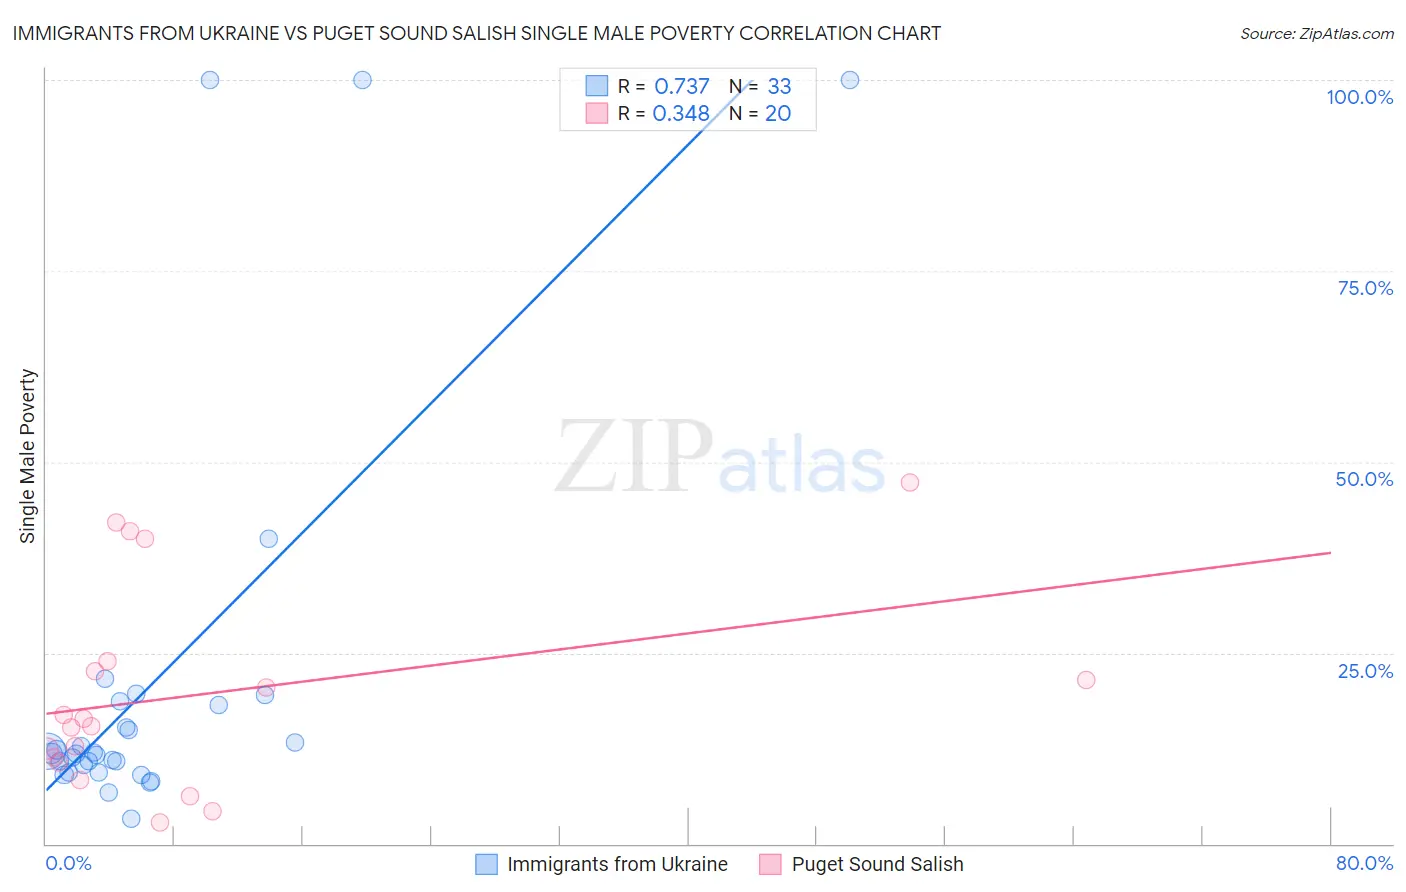
Immigrants from Ukraine vs Puget Sound Salish Single Male Poverty Correlation Chart
The statistical analysis conducted on geographies consisting of 259,108,555 people shows a strong positive correlation between the proportion of Immigrants from Ukraine and poverty level among single males in the United States with a correlation coefficient (R) of 0.737 and weighted average of 11.9%. Similarly, the statistical analysis conducted on geographies consisting of 44,306,636 people shows a mild positive correlation between the proportion of Puget Sound Salish and poverty level among single males in the United States with a correlation coefficient (R) of 0.348 and weighted average of 12.8%, a difference of 7.6%.
Single Male Poverty Correlation Summary
| Measurement | Immigrants from Ukraine | Puget Sound Salish |
| Minimum | 3.2% | 2.8% |
| Maximum | 100.0% | 47.4% |
| Range | 96.8% | 44.6% |
| Mean | 21.0% | 19.6% |
| Median | 11.8% | 15.9% |
| Interquartile 25% (IQ1) | 9.9% | 10.9% |
| Interquartile 75% (IQ3) | 18.4% | 23.3% |
| Interquartile Range (IQR) | 8.6% | 12.4% |
| Standard Deviation (Sample) | 26.1% | 13.2% |
| Standard Deviation (Population) | 25.7% | 12.9% |
Similar Demographics by Single Male Poverty
Demographics Similar to Immigrants from Ukraine by Single Male Poverty
In terms of single male poverty, the demographic groups most similar to Immigrants from Ukraine are Immigrants from Croatia (11.9%, a difference of 0.010%), Laotian (11.9%, a difference of 0.020%), Immigrants from Uruguay (11.9%, a difference of 0.020%), Immigrants from Russia (11.9%, a difference of 0.040%), and Immigrants from Nepal (11.9%, a difference of 0.060%).
| Demographics | Rating | Rank | Single Male Poverty |
| Peruvians | 99.8 /100 | #60 | Exceptional 11.8% |
| Cambodians | 99.8 /100 | #61 | Exceptional 11.8% |
| Immigrants | Sri Lanka | 99.7 /100 | #62 | Exceptional 11.8% |
| Immigrants | Belarus | 99.7 /100 | #63 | Exceptional 11.8% |
| Immigrants | Eastern Europe | 99.6 /100 | #64 | Exceptional 11.8% |
| Laotians | 99.6 /100 | #65 | Exceptional 11.9% |
| Immigrants | Uruguay | 99.6 /100 | #66 | Exceptional 11.9% |
| Immigrants | Ukraine | 99.6 /100 | #67 | Exceptional 11.9% |
| Immigrants | Croatia | 99.6 /100 | #68 | Exceptional 11.9% |
| Immigrants | Russia | 99.6 /100 | #69 | Exceptional 11.9% |
| Immigrants | Nepal | 99.6 /100 | #70 | Exceptional 11.9% |
| Immigrants | Greece | 99.6 /100 | #71 | Exceptional 11.9% |
| Immigrants | Argentina | 99.5 /100 | #72 | Exceptional 11.9% |
| Argentineans | 99.5 /100 | #73 | Exceptional 11.9% |
| Chileans | 99.5 /100 | #74 | Exceptional 11.9% |
Demographics Similar to Puget Sound Salish by Single Male Poverty
In terms of single male poverty, the demographic groups most similar to Puget Sound Salish are Guyanese (12.8%, a difference of 0.12%), South African (12.8%, a difference of 0.15%), Danish (12.8%, a difference of 0.15%), Immigrants from Barbados (12.7%, a difference of 0.18%), and Immigrants from St. Vincent and the Grenadines (12.8%, a difference of 0.18%).
| Demographics | Rating | Rank | Single Male Poverty |
| Eastern Europeans | 63.3 /100 | #162 | Good 12.7% |
| Palestinians | 63.1 /100 | #163 | Good 12.7% |
| Immigrants | Nigeria | 62.8 /100 | #164 | Good 12.7% |
| Immigrants | Cambodia | 62.2 /100 | #165 | Good 12.7% |
| Immigrants | Guyana | 60.5 /100 | #166 | Good 12.7% |
| Immigrants | Sudan | 58.2 /100 | #167 | Average 12.7% |
| Immigrants | Barbados | 57.7 /100 | #168 | Average 12.7% |
| Puget Sound Salish | 54.3 /100 | #169 | Average 12.8% |
| Guyanese | 52.0 /100 | #170 | Average 12.8% |
| South Africans | 51.5 /100 | #171 | Average 12.8% |
| Danes | 51.4 /100 | #172 | Average 12.8% |
| Immigrants | St. Vincent and the Grenadines | 50.9 /100 | #173 | Average 12.8% |
| Costa Ricans | 50.0 /100 | #174 | Average 12.8% |
| Croatians | 48.9 /100 | #175 | Average 12.8% |
| Syrians | 48.4 /100 | #176 | Average 12.8% |