Icelander vs Immigrants from Jamaica Single Male Poverty
COMPARE
Icelander
Immigrants from Jamaica
Single Male Poverty
Single Male Poverty Comparison
Icelanders
Immigrants from Jamaica
12.5%
SINGLE MALE POVERTY
88.2/ 100
METRIC RATING
121st/ 347
METRIC RANK
13.0%
SINGLE MALE POVERTY
26.5/ 100
METRIC RATING
192nd/ 347
METRIC RANK
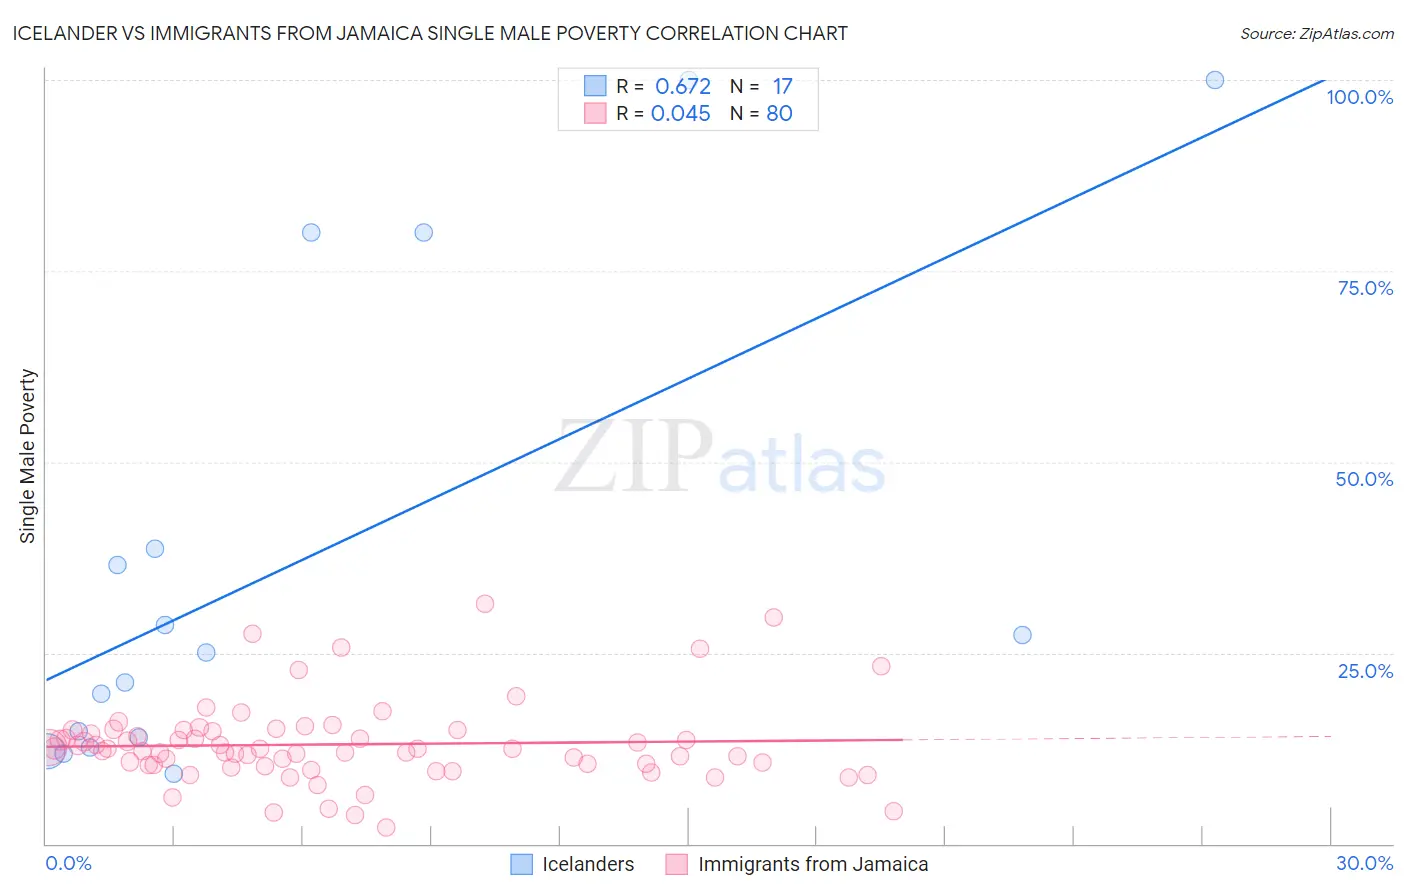
Icelander vs Immigrants from Jamaica Single Male Poverty Correlation Chart
The statistical analysis conducted on geographies consisting of 148,220,666 people shows a significant positive correlation between the proportion of Icelanders and poverty level among single males in the United States with a correlation coefficient (R) of 0.672 and weighted average of 12.5%. Similarly, the statistical analysis conducted on geographies consisting of 273,557,518 people shows no correlation between the proportion of Immigrants from Jamaica and poverty level among single males in the United States with a correlation coefficient (R) of 0.045 and weighted average of 13.0%, a difference of 4.1%.
Single Male Poverty Correlation Summary
| Measurement | Icelander | Immigrants from Jamaica |
| Minimum | 9.1% | 2.1% |
| Maximum | 100.0% | 31.5% |
| Range | 90.9% | 29.4% |
| Mean | 37.1% | 13.0% |
| Median | 25.0% | 12.4% |
| Interquartile 25% (IQ1) | 13.3% | 10.3% |
| Interquartile 75% (IQ3) | 59.3% | 14.7% |
| Interquartile Range (IQR) | 46.1% | 4.4% |
| Standard Deviation (Sample) | 31.8% | 5.4% |
| Standard Deviation (Population) | 30.8% | 5.3% |
Similar Demographics by Single Male Poverty
Demographics Similar to Icelanders by Single Male Poverty
In terms of single male poverty, the demographic groups most similar to Icelanders are Serbian (12.5%, a difference of 0.050%), Immigrants from Kenya (12.5%, a difference of 0.090%), Russian (12.5%, a difference of 0.12%), Immigrants from Jordan (12.5%, a difference of 0.15%), and Venezuelan (12.4%, a difference of 0.16%).
| Demographics | Rating | Rank | Single Male Poverty |
| Nicaraguans | 92.1 /100 | #114 | Exceptional 12.4% |
| Immigrants | Southern Europe | 91.5 /100 | #115 | Exceptional 12.4% |
| Immigrants | Syria | 91.2 /100 | #116 | Exceptional 12.4% |
| Immigrants | Oceania | 91.1 /100 | #117 | Exceptional 12.4% |
| Albanians | 90.6 /100 | #118 | Exceptional 12.4% |
| Immigrants | Albania | 90.3 /100 | #119 | Exceptional 12.4% |
| Venezuelans | 89.4 /100 | #120 | Excellent 12.4% |
| Icelanders | 88.2 /100 | #121 | Excellent 12.5% |
| Serbians | 87.9 /100 | #122 | Excellent 12.5% |
| Immigrants | Kenya | 87.6 /100 | #123 | Excellent 12.5% |
| Russians | 87.3 /100 | #124 | Excellent 12.5% |
| Immigrants | Jordan | 87.1 /100 | #125 | Excellent 12.5% |
| Romanians | 86.4 /100 | #126 | Excellent 12.5% |
| Immigrants | Netherlands | 86.2 /100 | #127 | Excellent 12.5% |
| Ecuadorians | 85.9 /100 | #128 | Excellent 12.5% |
Demographics Similar to Immigrants from Jamaica by Single Male Poverty
In terms of single male poverty, the demographic groups most similar to Immigrants from Jamaica are Immigrants from Thailand (13.0%, a difference of 0.010%), Immigrants from South Africa (13.0%, a difference of 0.020%), Arab (13.0%, a difference of 0.040%), Liberian (13.0%, a difference of 0.090%), and Immigrants from England (13.0%, a difference of 0.22%).
| Demographics | Rating | Rank | Single Male Poverty |
| Norwegians | 32.0 /100 | #185 | Fair 12.9% |
| Nigerians | 31.9 /100 | #186 | Fair 12.9% |
| Immigrants | Kuwait | 31.9 /100 | #187 | Fair 12.9% |
| Macedonians | 31.5 /100 | #188 | Fair 12.9% |
| Portuguese | 30.2 /100 | #189 | Fair 12.9% |
| Arabs | 27.0 /100 | #190 | Fair 13.0% |
| Immigrants | Thailand | 26.6 /100 | #191 | Fair 13.0% |
| Immigrants | Jamaica | 26.5 /100 | #192 | Fair 13.0% |
| Immigrants | South Africa | 26.1 /100 | #193 | Fair 13.0% |
| Liberians | 25.2 /100 | #194 | Fair 13.0% |
| Immigrants | England | 23.4 /100 | #195 | Fair 13.0% |
| Immigrants | Grenada | 23.1 /100 | #196 | Fair 13.0% |
| Immigrants | Laos | 23.1 /100 | #197 | Fair 13.0% |
| Lithuanians | 22.1 /100 | #198 | Fair 13.0% |
| Immigrants | Norway | 21.8 /100 | #199 | Fair 13.0% |