Icelander vs Nepalese Single Male Poverty
COMPARE
Icelander
Nepalese
Single Male Poverty
Single Male Poverty Comparison
Icelanders
Nepalese
12.5%
SINGLE MALE POVERTY
88.2/ 100
METRIC RATING
121st/ 347
METRIC RANK
11.6%
SINGLE MALE POVERTY
99.9/ 100
METRIC RATING
47th/ 347
METRIC RANK
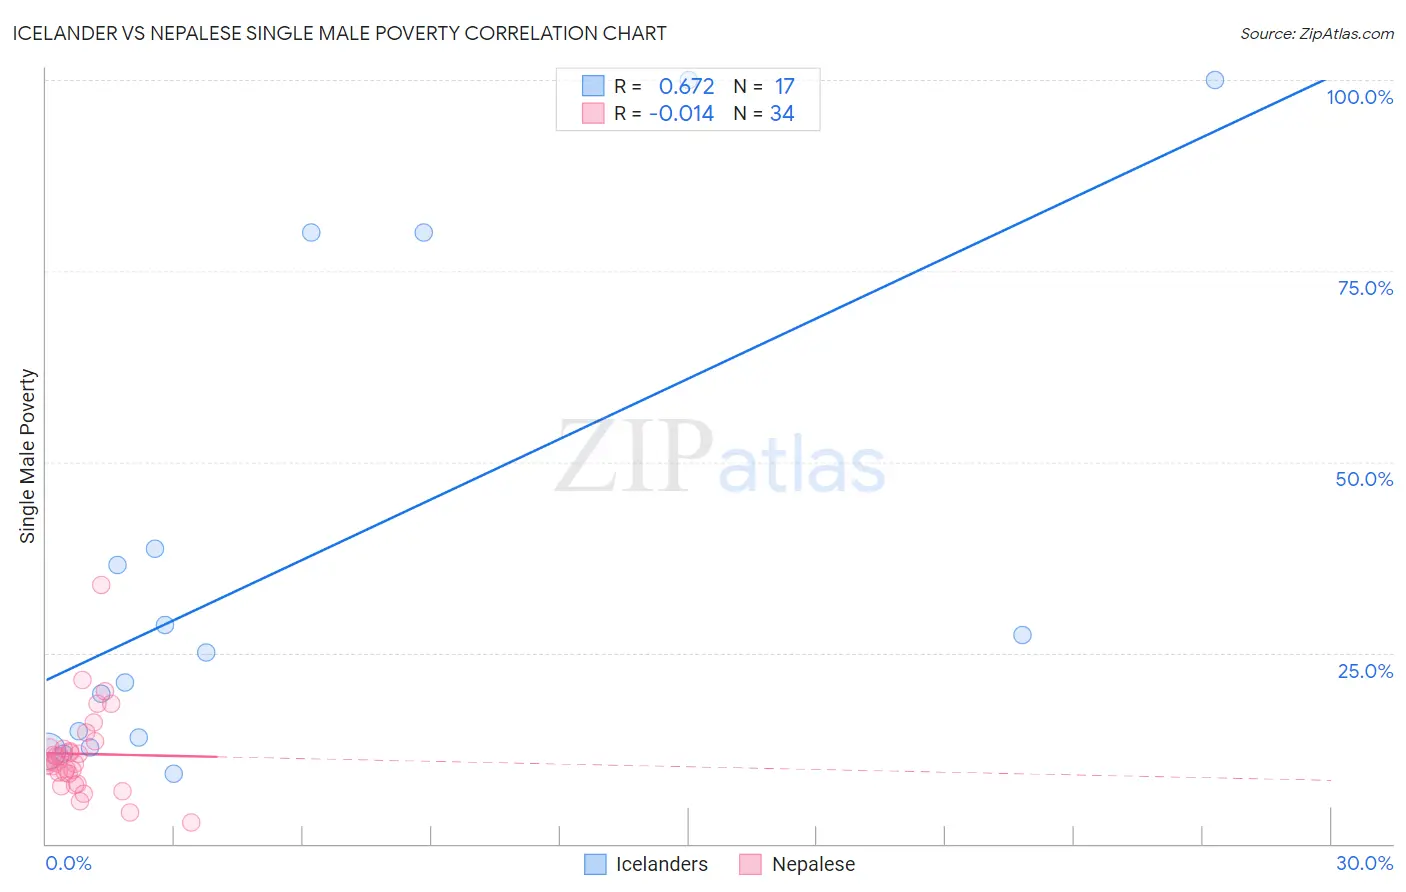
Icelander vs Nepalese Single Male Poverty Correlation Chart
The statistical analysis conducted on geographies consisting of 148,220,666 people shows a significant positive correlation between the proportion of Icelanders and poverty level among single males in the United States with a correlation coefficient (R) of 0.672 and weighted average of 12.5%. Similarly, the statistical analysis conducted on geographies consisting of 24,210,854 people shows no correlation between the proportion of Nepalese and poverty level among single males in the United States with a correlation coefficient (R) of -0.014 and weighted average of 11.6%, a difference of 7.5%.
Single Male Poverty Correlation Summary
| Measurement | Icelander | Nepalese |
| Minimum | 9.1% | 2.8% |
| Maximum | 100.0% | 33.9% |
| Range | 90.9% | 31.1% |
| Mean | 37.1% | 11.8% |
| Median | 25.0% | 10.7% |
| Interquartile 25% (IQ1) | 13.3% | 9.1% |
| Interquartile 75% (IQ3) | 59.3% | 12.7% |
| Interquartile Range (IQR) | 46.1% | 3.6% |
| Standard Deviation (Sample) | 31.8% | 5.7% |
| Standard Deviation (Population) | 30.8% | 5.6% |
Similar Demographics by Single Male Poverty
Demographics Similar to Icelanders by Single Male Poverty
In terms of single male poverty, the demographic groups most similar to Icelanders are Serbian (12.5%, a difference of 0.050%), Immigrants from Kenya (12.5%, a difference of 0.090%), Russian (12.5%, a difference of 0.12%), Immigrants from Jordan (12.5%, a difference of 0.15%), and Venezuelan (12.4%, a difference of 0.16%).
| Demographics | Rating | Rank | Single Male Poverty |
| Nicaraguans | 92.1 /100 | #114 | Exceptional 12.4% |
| Immigrants | Southern Europe | 91.5 /100 | #115 | Exceptional 12.4% |
| Immigrants | Syria | 91.2 /100 | #116 | Exceptional 12.4% |
| Immigrants | Oceania | 91.1 /100 | #117 | Exceptional 12.4% |
| Albanians | 90.6 /100 | #118 | Exceptional 12.4% |
| Immigrants | Albania | 90.3 /100 | #119 | Exceptional 12.4% |
| Venezuelans | 89.4 /100 | #120 | Excellent 12.4% |
| Icelanders | 88.2 /100 | #121 | Excellent 12.5% |
| Serbians | 87.9 /100 | #122 | Excellent 12.5% |
| Immigrants | Kenya | 87.6 /100 | #123 | Excellent 12.5% |
| Russians | 87.3 /100 | #124 | Excellent 12.5% |
| Immigrants | Jordan | 87.1 /100 | #125 | Excellent 12.5% |
| Romanians | 86.4 /100 | #126 | Excellent 12.5% |
| Immigrants | Netherlands | 86.2 /100 | #127 | Excellent 12.5% |
| Ecuadorians | 85.9 /100 | #128 | Excellent 12.5% |
Demographics Similar to Nepalese by Single Male Poverty
In terms of single male poverty, the demographic groups most similar to Nepalese are Immigrants from Indonesia (11.6%, a difference of 0.080%), Tlingit-Haida (11.6%, a difference of 0.10%), Immigrants from Lithuania (11.6%, a difference of 0.15%), Immigrants from Bulgaria (11.6%, a difference of 0.20%), and Paraguayan (11.6%, a difference of 0.26%).
| Demographics | Rating | Rank | Single Male Poverty |
| Immigrants | Korea | 100.0 /100 | #40 | Exceptional 11.5% |
| Immigrants | Iraq | 99.9 /100 | #41 | Exceptional 11.5% |
| Egyptians | 99.9 /100 | #42 | Exceptional 11.5% |
| Immigrants | Peru | 99.9 /100 | #43 | Exceptional 11.5% |
| Immigrants | Cameroon | 99.9 /100 | #44 | Exceptional 11.5% |
| Immigrants | Poland | 99.9 /100 | #45 | Exceptional 11.5% |
| Immigrants | Bulgaria | 99.9 /100 | #46 | Exceptional 11.6% |
| Nepalese | 99.9 /100 | #47 | Exceptional 11.6% |
| Immigrants | Indonesia | 99.9 /100 | #48 | Exceptional 11.6% |
| Tlingit-Haida | 99.9 /100 | #49 | Exceptional 11.6% |
| Immigrants | Lithuania | 99.9 /100 | #50 | Exceptional 11.6% |
| Paraguayans | 99.9 /100 | #51 | Exceptional 11.6% |
| Samoans | 99.9 /100 | #52 | Exceptional 11.7% |
| Bulgarians | 99.9 /100 | #53 | Exceptional 11.7% |
| Immigrants | Uzbekistan | 99.9 /100 | #54 | Exceptional 11.7% |