Icelander vs Immigrants from Congo Single Male Poverty
COMPARE
Icelander
Immigrants from Congo
Single Male Poverty
Single Male Poverty Comparison
Icelanders
Immigrants from Congo
12.5%
SINGLE MALE POVERTY
88.2/ 100
METRIC RATING
121st/ 347
METRIC RANK
13.9%
SINGLE MALE POVERTY
0.2/ 100
METRIC RATING
265th/ 347
METRIC RANK
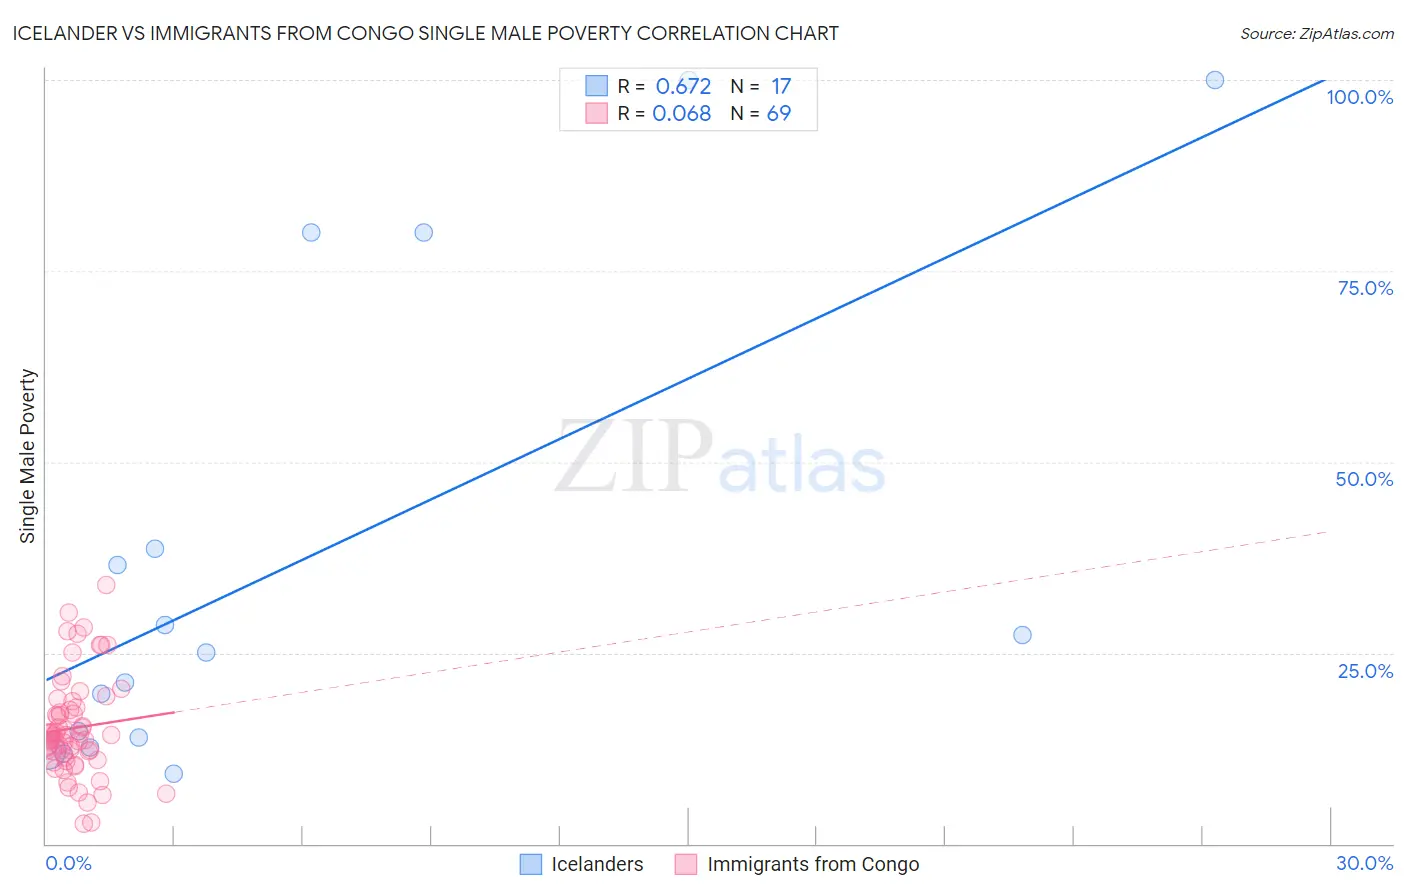
Icelander vs Immigrants from Congo Single Male Poverty Correlation Chart
The statistical analysis conducted on geographies consisting of 148,220,666 people shows a significant positive correlation between the proportion of Icelanders and poverty level among single males in the United States with a correlation coefficient (R) of 0.672 and weighted average of 12.5%. Similarly, the statistical analysis conducted on geographies consisting of 89,882,140 people shows a slight positive correlation between the proportion of Immigrants from Congo and poverty level among single males in the United States with a correlation coefficient (R) of 0.068 and weighted average of 13.9%, a difference of 11.4%.
Single Male Poverty Correlation Summary
| Measurement | Icelander | Immigrants from Congo |
| Minimum | 9.1% | 2.6% |
| Maximum | 100.0% | 33.9% |
| Range | 90.9% | 31.2% |
| Mean | 37.1% | 15.1% |
| Median | 25.0% | 14.3% |
| Interquartile 25% (IQ1) | 13.3% | 11.7% |
| Interquartile 75% (IQ3) | 59.3% | 17.7% |
| Interquartile Range (IQR) | 46.1% | 6.0% |
| Standard Deviation (Sample) | 31.8% | 6.4% |
| Standard Deviation (Population) | 30.8% | 6.4% |
Similar Demographics by Single Male Poverty
Demographics Similar to Icelanders by Single Male Poverty
In terms of single male poverty, the demographic groups most similar to Icelanders are Serbian (12.5%, a difference of 0.050%), Immigrants from Kenya (12.5%, a difference of 0.090%), Russian (12.5%, a difference of 0.12%), Immigrants from Jordan (12.5%, a difference of 0.15%), and Venezuelan (12.4%, a difference of 0.16%).
| Demographics | Rating | Rank | Single Male Poverty |
| Nicaraguans | 92.1 /100 | #114 | Exceptional 12.4% |
| Immigrants | Southern Europe | 91.5 /100 | #115 | Exceptional 12.4% |
| Immigrants | Syria | 91.2 /100 | #116 | Exceptional 12.4% |
| Immigrants | Oceania | 91.1 /100 | #117 | Exceptional 12.4% |
| Albanians | 90.6 /100 | #118 | Exceptional 12.4% |
| Immigrants | Albania | 90.3 /100 | #119 | Exceptional 12.4% |
| Venezuelans | 89.4 /100 | #120 | Excellent 12.4% |
| Icelanders | 88.2 /100 | #121 | Excellent 12.5% |
| Serbians | 87.9 /100 | #122 | Excellent 12.5% |
| Immigrants | Kenya | 87.6 /100 | #123 | Excellent 12.5% |
| Russians | 87.3 /100 | #124 | Excellent 12.5% |
| Immigrants | Jordan | 87.1 /100 | #125 | Excellent 12.5% |
| Romanians | 86.4 /100 | #126 | Excellent 12.5% |
| Immigrants | Netherlands | 86.2 /100 | #127 | Excellent 12.5% |
| Ecuadorians | 85.9 /100 | #128 | Excellent 12.5% |
Demographics Similar to Immigrants from Congo by Single Male Poverty
In terms of single male poverty, the demographic groups most similar to Immigrants from Congo are West Indian (13.8%, a difference of 0.16%), Immigrants from Cabo Verde (13.9%, a difference of 0.31%), Cape Verdean (13.8%, a difference of 0.35%), Fijian (13.8%, a difference of 0.47%), and German (13.9%, a difference of 0.47%).
| Demographics | Rating | Rank | Single Male Poverty |
| Immigrants | Guatemala | 0.3 /100 | #258 | Tragic 13.8% |
| Guatemalans | 0.3 /100 | #259 | Tragic 13.8% |
| Swiss | 0.3 /100 | #260 | Tragic 13.8% |
| Hungarians | 0.3 /100 | #261 | Tragic 13.8% |
| Fijians | 0.3 /100 | #262 | Tragic 13.8% |
| Cape Verdeans | 0.2 /100 | #263 | Tragic 13.8% |
| West Indians | 0.2 /100 | #264 | Tragic 13.8% |
| Immigrants | Congo | 0.2 /100 | #265 | Tragic 13.9% |
| Immigrants | Cabo Verde | 0.1 /100 | #266 | Tragic 13.9% |
| Germans | 0.1 /100 | #267 | Tragic 13.9% |
| Immigrants | Mexico | 0.1 /100 | #268 | Tragic 13.9% |
| Scottish | 0.1 /100 | #269 | Tragic 14.0% |
| Immigrants | Saudi Arabia | 0.1 /100 | #270 | Tragic 14.0% |
| Irish | 0.1 /100 | #271 | Tragic 14.0% |
| Mexicans | 0.1 /100 | #272 | Tragic 14.0% |