Icelander vs Belizean Single Male Poverty
COMPARE
Icelander
Belizean
Single Male Poverty
Single Male Poverty Comparison
Icelanders
Belizeans
12.5%
SINGLE MALE POVERTY
88.2/ 100
METRIC RATING
121st/ 347
METRIC RANK
13.4%
SINGLE MALE POVERTY
2.3/ 100
METRIC RATING
240th/ 347
METRIC RANK
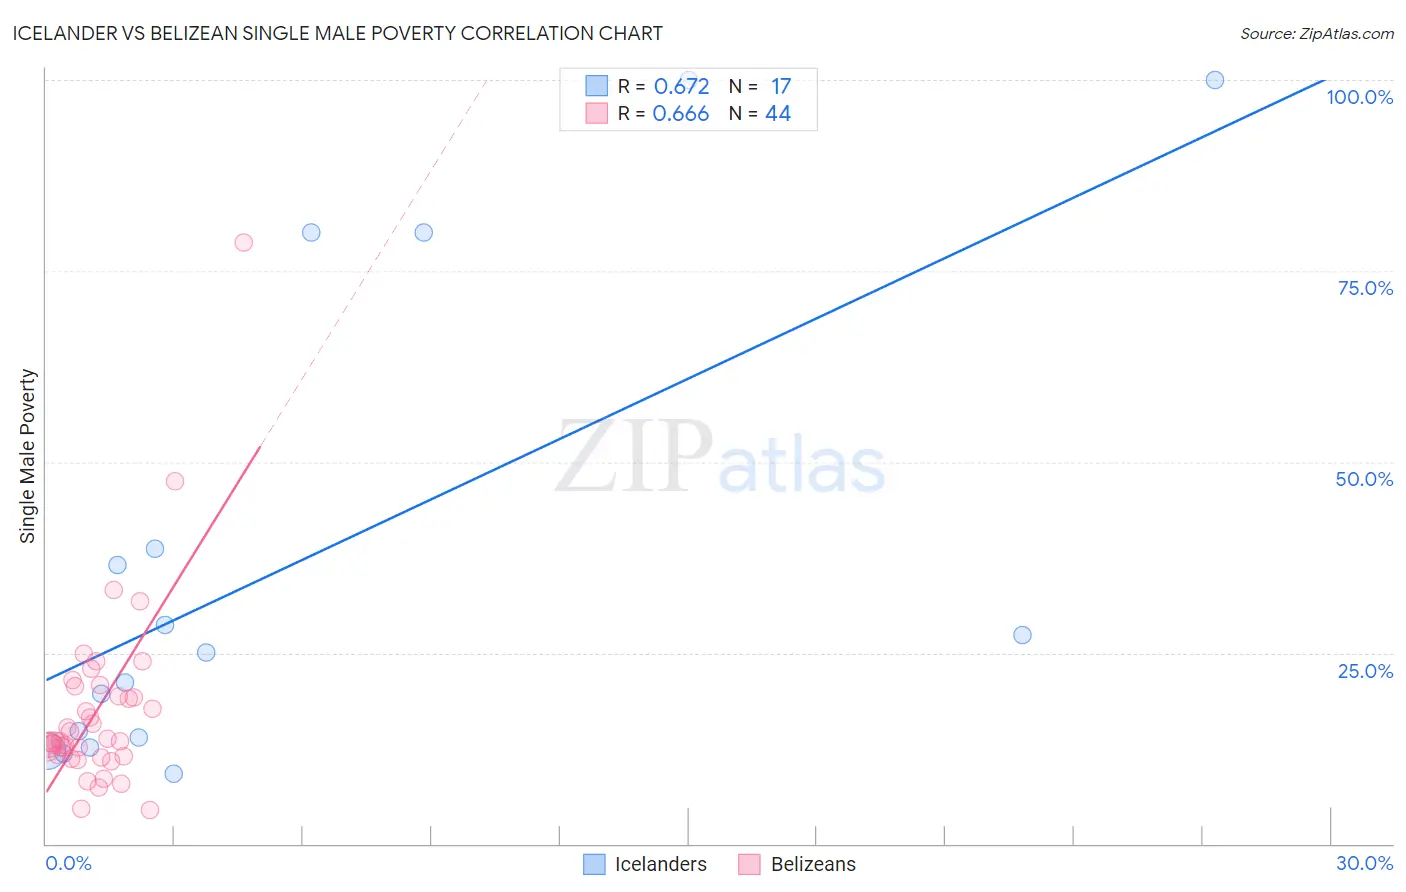
Icelander vs Belizean Single Male Poverty Correlation Chart
The statistical analysis conducted on geographies consisting of 148,220,666 people shows a significant positive correlation between the proportion of Icelanders and poverty level among single males in the United States with a correlation coefficient (R) of 0.672 and weighted average of 12.5%. Similarly, the statistical analysis conducted on geographies consisting of 138,781,129 people shows a significant positive correlation between the proportion of Belizeans and poverty level among single males in the United States with a correlation coefficient (R) of 0.666 and weighted average of 13.4%, a difference of 7.8%.
Single Male Poverty Correlation Summary
| Measurement | Icelander | Belizean |
| Minimum | 9.1% | 4.5% |
| Maximum | 100.0% | 78.7% |
| Range | 90.9% | 74.2% |
| Mean | 37.1% | 17.5% |
| Median | 25.0% | 13.4% |
| Interquartile 25% (IQ1) | 13.3% | 11.5% |
| Interquartile 75% (IQ3) | 59.3% | 20.0% |
| Interquartile Range (IQR) | 46.1% | 8.5% |
| Standard Deviation (Sample) | 31.8% | 12.3% |
| Standard Deviation (Population) | 30.8% | 12.2% |
Similar Demographics by Single Male Poverty
Demographics Similar to Icelanders by Single Male Poverty
In terms of single male poverty, the demographic groups most similar to Icelanders are Serbian (12.5%, a difference of 0.050%), Immigrants from Kenya (12.5%, a difference of 0.090%), Russian (12.5%, a difference of 0.12%), Immigrants from Jordan (12.5%, a difference of 0.15%), and Venezuelan (12.4%, a difference of 0.16%).
| Demographics | Rating | Rank | Single Male Poverty |
| Nicaraguans | 92.1 /100 | #114 | Exceptional 12.4% |
| Immigrants | Southern Europe | 91.5 /100 | #115 | Exceptional 12.4% |
| Immigrants | Syria | 91.2 /100 | #116 | Exceptional 12.4% |
| Immigrants | Oceania | 91.1 /100 | #117 | Exceptional 12.4% |
| Albanians | 90.6 /100 | #118 | Exceptional 12.4% |
| Immigrants | Albania | 90.3 /100 | #119 | Exceptional 12.4% |
| Venezuelans | 89.4 /100 | #120 | Excellent 12.4% |
| Icelanders | 88.2 /100 | #121 | Excellent 12.5% |
| Serbians | 87.9 /100 | #122 | Excellent 12.5% |
| Immigrants | Kenya | 87.6 /100 | #123 | Excellent 12.5% |
| Russians | 87.3 /100 | #124 | Excellent 12.5% |
| Immigrants | Jordan | 87.1 /100 | #125 | Excellent 12.5% |
| Romanians | 86.4 /100 | #126 | Excellent 12.5% |
| Immigrants | Netherlands | 86.2 /100 | #127 | Excellent 12.5% |
| Ecuadorians | 85.9 /100 | #128 | Excellent 12.5% |
Demographics Similar to Belizeans by Single Male Poverty
In terms of single male poverty, the demographic groups most similar to Belizeans are Immigrants from Germany (13.4%, a difference of 0.11%), Carpatho Rusyn (13.4%, a difference of 0.12%), Barbadian (13.4%, a difference of 0.17%), Czechoslovakian (13.4%, a difference of 0.30%), and Immigrants from Ghana (13.4%, a difference of 0.39%).
| Demographics | Rating | Rank | Single Male Poverty |
| British | 4.0 /100 | #233 | Tragic 13.3% |
| Canadians | 4.0 /100 | #234 | Tragic 13.3% |
| Bangladeshis | 3.7 /100 | #235 | Tragic 13.3% |
| Luxembourgers | 3.6 /100 | #236 | Tragic 13.4% |
| British West Indians | 3.4 /100 | #237 | Tragic 13.4% |
| Immigrants | Ghana | 3.2 /100 | #238 | Tragic 13.4% |
| Czechoslovakians | 3.0 /100 | #239 | Tragic 13.4% |
| Belizeans | 2.3 /100 | #240 | Tragic 13.4% |
| Immigrants | Germany | 2.1 /100 | #241 | Tragic 13.4% |
| Carpatho Rusyns | 2.1 /100 | #242 | Tragic 13.4% |
| Barbadians | 2.1 /100 | #243 | Tragic 13.4% |
| Immigrants | Senegal | 1.7 /100 | #244 | Tragic 13.5% |
| Immigrants | Latin America | 1.3 /100 | #245 | Tragic 13.5% |
| Immigrants | Micronesia | 1.2 /100 | #246 | Tragic 13.5% |
| Belgians | 1.2 /100 | #247 | Tragic 13.5% |