Hungarian vs Immigrants from Pakistan Single Male Poverty
COMPARE
Hungarian
Immigrants from Pakistan
Single Male Poverty
Single Male Poverty Comparison
Hungarians
Immigrants from Pakistan
13.8%
SINGLE MALE POVERTY
0.3/ 100
METRIC RATING
261st/ 347
METRIC RANK
11.2%
SINGLE MALE POVERTY
100.0/ 100
METRIC RATING
22nd/ 347
METRIC RANK
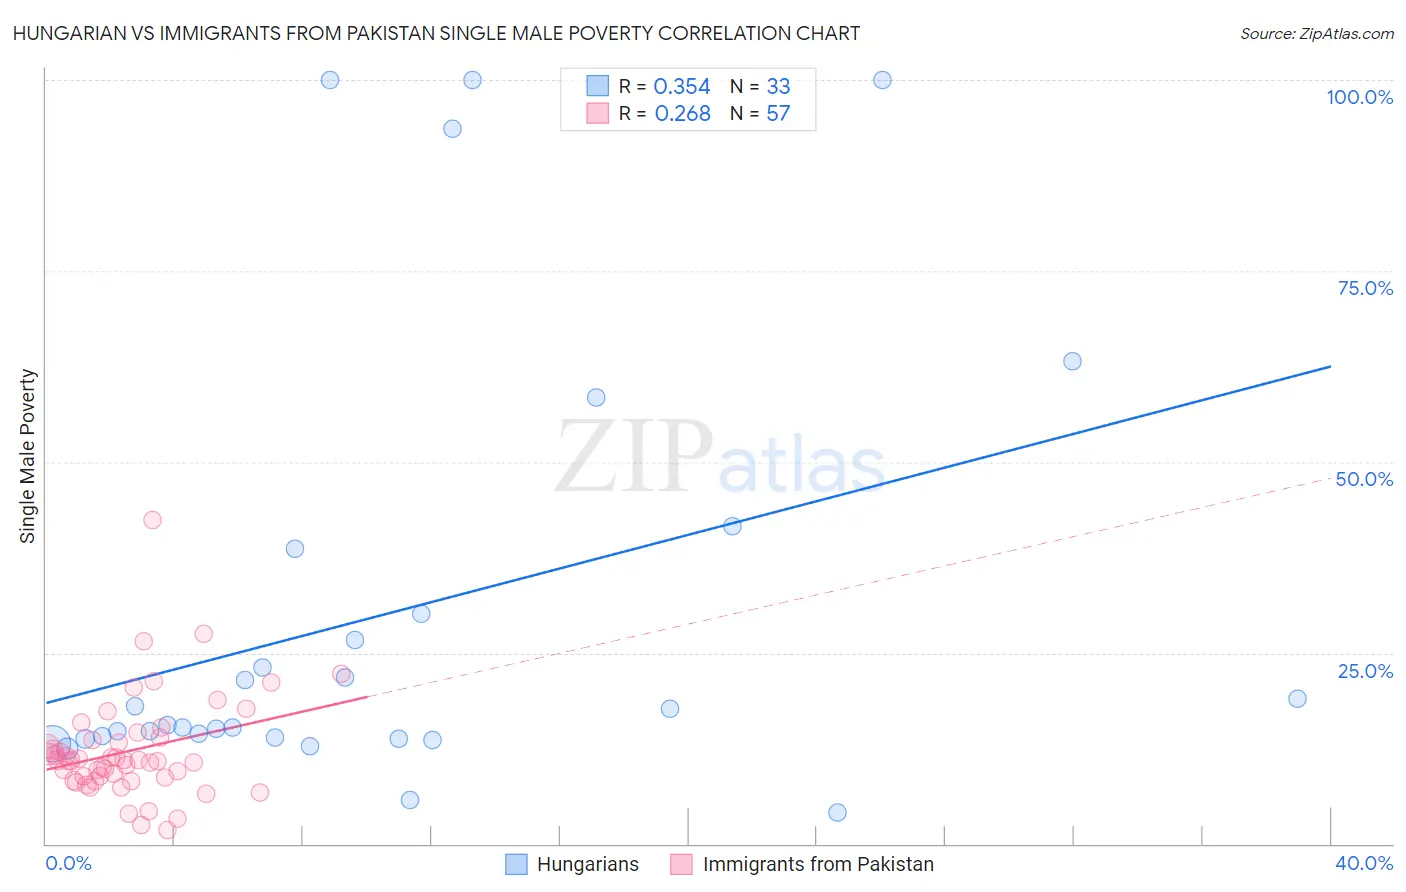
Hungarian vs Immigrants from Pakistan Single Male Poverty Correlation Chart
The statistical analysis conducted on geographies consisting of 413,693,148 people shows a mild positive correlation between the proportion of Hungarians and poverty level among single males in the United States with a correlation coefficient (R) of 0.354 and weighted average of 13.8%. Similarly, the statistical analysis conducted on geographies consisting of 256,771,473 people shows a weak positive correlation between the proportion of Immigrants from Pakistan and poverty level among single males in the United States with a correlation coefficient (R) of 0.268 and weighted average of 11.2%, a difference of 22.9%.
Single Male Poverty Correlation Summary
| Measurement | Hungarian | Immigrants from Pakistan |
| Minimum | 4.0% | 1.8% |
| Maximum | 100.0% | 42.3% |
| Range | 96.0% | 40.5% |
| Mean | 30.2% | 12.1% |
| Median | 15.5% | 10.9% |
| Interquartile 25% (IQ1) | 13.9% | 8.5% |
| Interquartile 75% (IQ3) | 34.3% | 13.8% |
| Interquartile Range (IQR) | 20.5% | 5.3% |
| Standard Deviation (Sample) | 28.8% | 6.7% |
| Standard Deviation (Population) | 28.4% | 6.6% |
Similar Demographics by Single Male Poverty
Demographics Similar to Hungarians by Single Male Poverty
In terms of single male poverty, the demographic groups most similar to Hungarians are Swiss (13.8%, a difference of 0.050%), Guatemalan (13.8%, a difference of 0.12%), Immigrants from Guatemala (13.8%, a difference of 0.16%), Fijian (13.8%, a difference of 0.17%), and Immigrants from Central America (13.8%, a difference of 0.23%).
| Demographics | Rating | Rank | Single Male Poverty |
| Sub-Saharan Africans | 0.5 /100 | #254 | Tragic 13.7% |
| Spaniards | 0.4 /100 | #255 | Tragic 13.7% |
| Immigrants | Belize | 0.4 /100 | #256 | Tragic 13.7% |
| Immigrants | Central America | 0.3 /100 | #257 | Tragic 13.8% |
| Immigrants | Guatemala | 0.3 /100 | #258 | Tragic 13.8% |
| Guatemalans | 0.3 /100 | #259 | Tragic 13.8% |
| Swiss | 0.3 /100 | #260 | Tragic 13.8% |
| Hungarians | 0.3 /100 | #261 | Tragic 13.8% |
| Fijians | 0.3 /100 | #262 | Tragic 13.8% |
| Cape Verdeans | 0.2 /100 | #263 | Tragic 13.8% |
| West Indians | 0.2 /100 | #264 | Tragic 13.8% |
| Immigrants | Congo | 0.2 /100 | #265 | Tragic 13.9% |
| Immigrants | Cabo Verde | 0.1 /100 | #266 | Tragic 13.9% |
| Germans | 0.1 /100 | #267 | Tragic 13.9% |
| Immigrants | Mexico | 0.1 /100 | #268 | Tragic 13.9% |
Demographics Similar to Immigrants from Pakistan by Single Male Poverty
In terms of single male poverty, the demographic groups most similar to Immigrants from Pakistan are Asian (11.2%, a difference of 0.090%), Bolivian (11.2%, a difference of 0.21%), Indian (Asian) (11.3%, a difference of 0.41%), Maltese (11.3%, a difference of 0.43%), and Ethiopian (11.2%, a difference of 0.44%).
| Demographics | Rating | Rank | Single Male Poverty |
| Koreans | 100.0 /100 | #15 | Exceptional 11.0% |
| Bhutanese | 100.0 /100 | #16 | Exceptional 11.1% |
| Tsimshian | 100.0 /100 | #17 | Exceptional 11.1% |
| Immigrants | Bolivia | 100.0 /100 | #18 | Exceptional 11.1% |
| Immigrants | Moldova | 100.0 /100 | #19 | Exceptional 11.2% |
| Ethiopians | 100.0 /100 | #20 | Exceptional 11.2% |
| Asians | 100.0 /100 | #21 | Exceptional 11.2% |
| Immigrants | Pakistan | 100.0 /100 | #22 | Exceptional 11.2% |
| Bolivians | 100.0 /100 | #23 | Exceptional 11.2% |
| Indians (Asian) | 100.0 /100 | #24 | Exceptional 11.3% |
| Maltese | 100.0 /100 | #25 | Exceptional 11.3% |
| Immigrants | Japan | 100.0 /100 | #26 | Exceptional 11.3% |
| Immigrants | China | 100.0 /100 | #27 | Exceptional 11.4% |
| Immigrants | Asia | 100.0 /100 | #28 | Exceptional 11.4% |
| Immigrants | Egypt | 100.0 /100 | #29 | Exceptional 11.4% |