Hungarian vs Apache Seniors Poverty Over the Age of 65
COMPARE
Hungarian
Apache
Seniors Poverty Over the Age of 65
Seniors Poverty Over the Age of 65 Comparison
Hungarians
Apache
9.7%
SENIORS POVERTY OVER THE AGE OF 65
99.4/ 100
METRIC RATING
50th/ 347
METRIC RANK
13.9%
SENIORS POVERTY OVER THE AGE OF 65
0.0/ 100
METRIC RATING
295th/ 347
METRIC RANK
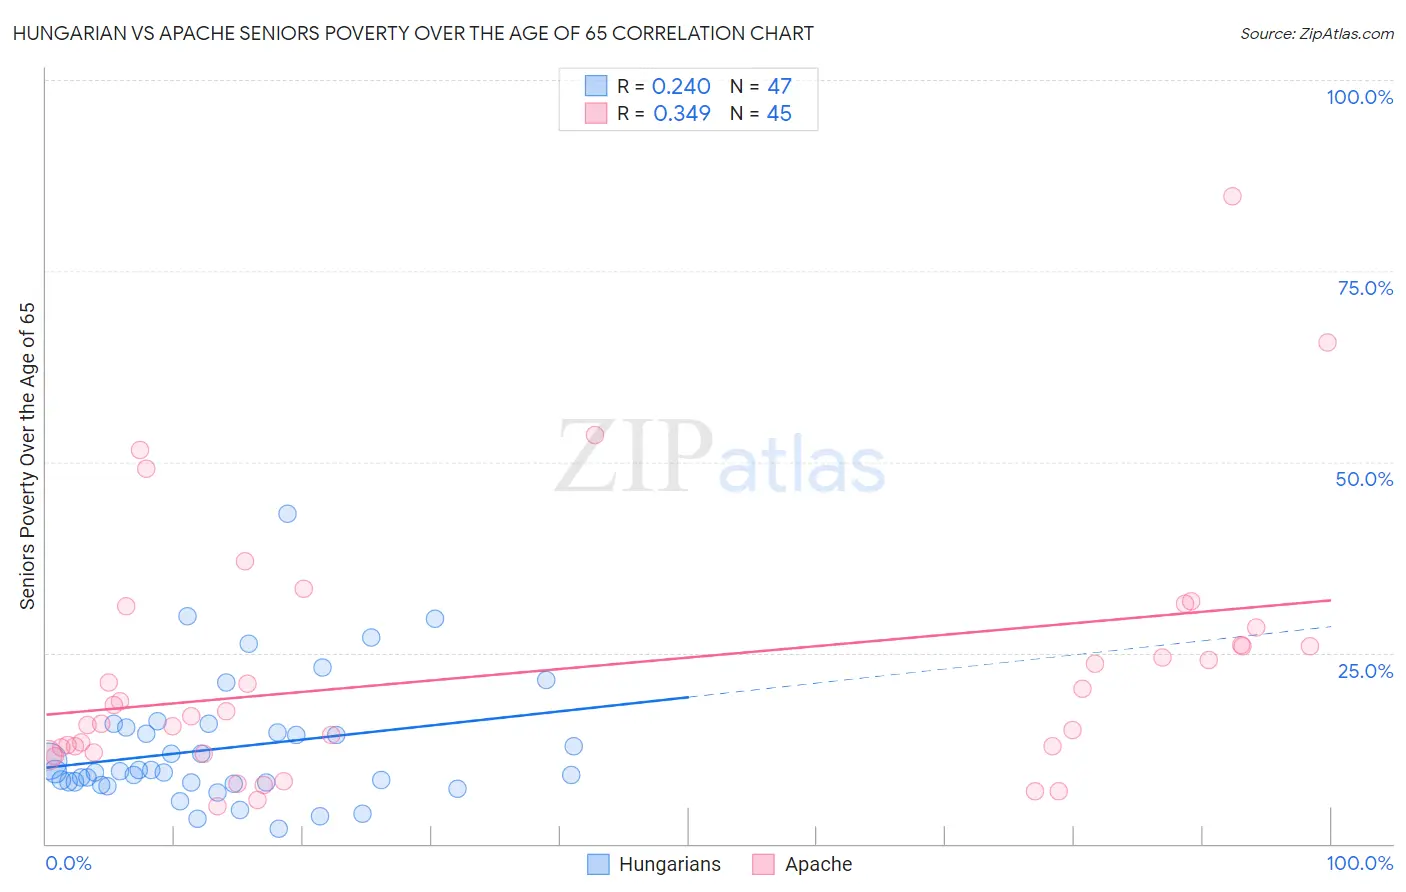
Hungarian vs Apache Seniors Poverty Over the Age of 65 Correlation Chart
The statistical analysis conducted on geographies consisting of 483,559,616 people shows a weak positive correlation between the proportion of Hungarians and poverty level among seniors over the age of 65 in the United States with a correlation coefficient (R) of 0.240 and weighted average of 9.7%. Similarly, the statistical analysis conducted on geographies consisting of 230,541,772 people shows a mild positive correlation between the proportion of Apache and poverty level among seniors over the age of 65 in the United States with a correlation coefficient (R) of 0.349 and weighted average of 13.9%, a difference of 43.4%.
Seniors Poverty Over the Age of 65 Correlation Summary
| Measurement | Hungarian | Apache |
| Minimum | 1.9% | 4.9% |
| Maximum | 43.2% | 84.8% |
| Range | 41.3% | 79.9% |
| Mean | 12.6% | 22.6% |
| Median | 9.5% | 17.3% |
| Interquartile 25% (IQ1) | 7.9% | 12.3% |
| Interquartile 75% (IQ3) | 15.2% | 27.1% |
| Interquartile Range (IQR) | 7.3% | 14.8% |
| Standard Deviation (Sample) | 8.2% | 16.5% |
| Standard Deviation (Population) | 8.1% | 16.3% |
Similar Demographics by Seniors Poverty Over the Age of 65
Demographics Similar to Hungarians by Seniors Poverty Over the Age of 65
In terms of seniors poverty over the age of 65, the demographic groups most similar to Hungarians are Immigrants from Lithuania (9.7%, a difference of 0.22%), French (9.7%, a difference of 0.28%), Immigrants from South Central Asia (9.7%, a difference of 0.39%), Immigrants from Taiwan (9.7%, a difference of 0.40%), and Carpatho Rusyn (9.7%, a difference of 0.48%).
| Demographics | Rating | Rank | Seniors Poverty Over the Age of 65 |
| Eastern Europeans | 99.6 /100 | #43 | Exceptional 9.6% |
| Austrians | 99.5 /100 | #44 | Exceptional 9.6% |
| Estonians | 99.5 /100 | #45 | Exceptional 9.6% |
| Immigrants | Taiwan | 99.5 /100 | #46 | Exceptional 9.7% |
| Immigrants | South Central Asia | 99.5 /100 | #47 | Exceptional 9.7% |
| French | 99.5 /100 | #48 | Exceptional 9.7% |
| Immigrants | Lithuania | 99.4 /100 | #49 | Exceptional 9.7% |
| Hungarians | 99.4 /100 | #50 | Exceptional 9.7% |
| Carpatho Rusyns | 99.3 /100 | #51 | Exceptional 9.7% |
| Filipinos | 99.3 /100 | #52 | Exceptional 9.7% |
| Slavs | 99.2 /100 | #53 | Exceptional 9.8% |
| Immigrants | Northern Europe | 99.2 /100 | #54 | Exceptional 9.8% |
| Afghans | 99.2 /100 | #55 | Exceptional 9.8% |
| Immigrants | England | 99.1 /100 | #56 | Exceptional 9.8% |
| Bolivians | 99.1 /100 | #57 | Exceptional 9.8% |
Demographics Similar to Apache by Seniors Poverty Over the Age of 65
In terms of seniors poverty over the age of 65, the demographic groups most similar to Apache are Cheyenne (13.9%, a difference of 0.19%), Immigrants from Jamaica (13.9%, a difference of 0.27%), Vietnamese (14.0%, a difference of 0.34%), Immigrants from Guatemala (13.8%, a difference of 0.61%), and Immigrants from Belize (14.0%, a difference of 0.63%).
| Demographics | Rating | Rank | Seniors Poverty Over the Age of 65 |
| Belizeans | 0.0 /100 | #288 | Tragic 13.6% |
| Jamaicans | 0.0 /100 | #289 | Tragic 13.6% |
| Immigrants | Central America | 0.0 /100 | #290 | Tragic 13.6% |
| Blacks/African Americans | 0.0 /100 | #291 | Tragic 13.7% |
| Spanish American Indians | 0.0 /100 | #292 | Tragic 13.8% |
| Immigrants | Guatemala | 0.0 /100 | #293 | Tragic 13.8% |
| Cheyenne | 0.0 /100 | #294 | Tragic 13.9% |
| Apache | 0.0 /100 | #295 | Tragic 13.9% |
| Immigrants | Jamaica | 0.0 /100 | #296 | Tragic 13.9% |
| Vietnamese | 0.0 /100 | #297 | Tragic 14.0% |
| Immigrants | Belize | 0.0 /100 | #298 | Tragic 14.0% |
| Ecuadorians | 0.0 /100 | #299 | Tragic 14.0% |
| Immigrants | Uzbekistan | 0.0 /100 | #300 | Tragic 14.0% |
| U.S. Virgin Islanders | 0.0 /100 | #301 | Tragic 14.0% |
| Yup'ik | 0.0 /100 | #302 | Tragic 14.1% |