Hungarian vs Apache Per Capita Income
COMPARE
Hungarian
Apache
Per Capita Income
Per Capita Income Comparison
Hungarians
Apache
$45,426
PER CAPITA INCOME
87.9/ 100
METRIC RATING
135th/ 347
METRIC RANK
$34,886
PER CAPITA INCOME
0.0/ 100
METRIC RATING
327th/ 347
METRIC RANK
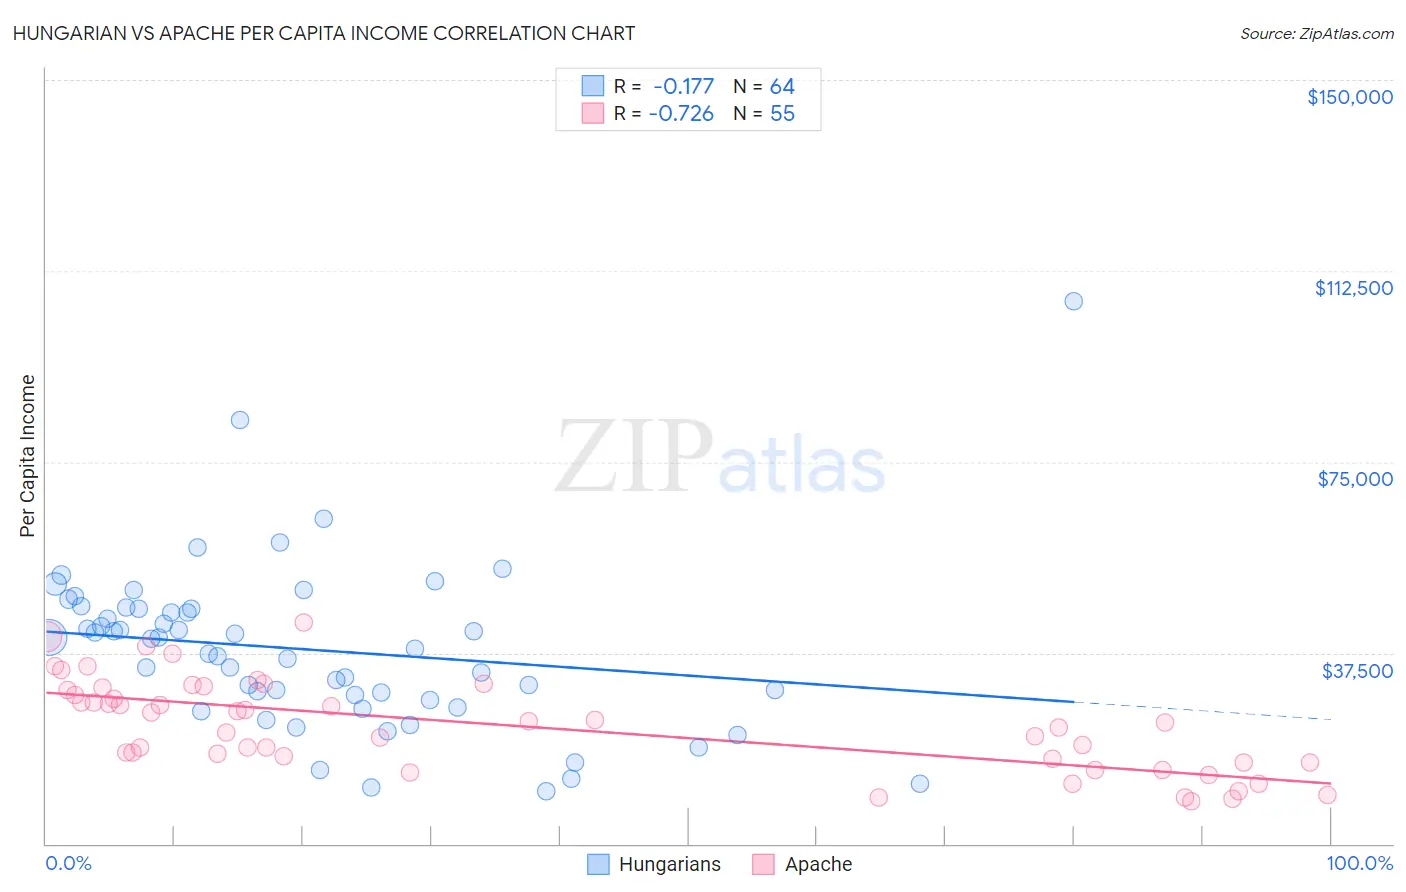
Hungarian vs Apache Per Capita Income Correlation Chart
The statistical analysis conducted on geographies consisting of 486,270,132 people shows a poor negative correlation between the proportion of Hungarians and per capita income in the United States with a correlation coefficient (R) of -0.177 and weighted average of $45,426. Similarly, the statistical analysis conducted on geographies consisting of 231,148,099 people shows a strong negative correlation between the proportion of Apache and per capita income in the United States with a correlation coefficient (R) of -0.726 and weighted average of $34,886, a difference of 30.2%.
Per Capita Income Correlation Summary
| Measurement | Hungarian | Apache |
| Minimum | $10,415 | $8,398 |
| Maximum | $106,430 | $43,430 |
| Range | $96,015 | $35,032 |
| Mean | $38,150 | $23,117 |
| Median | $39,313 | $23,775 |
| Interquartile 25% (IQ1) | $28,777 | $15,985 |
| Interquartile 75% (IQ3) | $46,125 | $30,233 |
| Interquartile Range (IQR) | $17,348 | $14,248 |
| Standard Deviation (Sample) | $16,236 | $8,932 |
| Standard Deviation (Population) | $16,109 | $8,851 |
Similar Demographics by Per Capita Income
Demographics Similar to Hungarians by Per Capita Income
In terms of per capita income, the demographic groups most similar to Hungarians are Slovene ($45,581, a difference of 0.34%), Pakistani ($45,587, a difference of 0.35%), Jordanian ($45,605, a difference of 0.39%), Immigrants from North Macedonia ($45,622, a difference of 0.43%), and Immigrants from Oceania ($45,220, a difference of 0.46%).
| Demographics | Rating | Rank | Per Capita Income |
| Swedes | 91.3 /100 | #128 | Exceptional $45,750 |
| Luxembourgers | 90.4 /100 | #129 | Exceptional $45,663 |
| Arabs | 90.4 /100 | #130 | Exceptional $45,662 |
| Immigrants | North Macedonia | 90.0 /100 | #131 | Exceptional $45,622 |
| Jordanians | 89.9 /100 | #132 | Excellent $45,605 |
| Pakistanis | 89.7 /100 | #133 | Excellent $45,587 |
| Slovenes | 89.6 /100 | #134 | Excellent $45,581 |
| Hungarians | 87.9 /100 | #135 | Excellent $45,426 |
| Immigrants | Oceania | 85.2 /100 | #136 | Excellent $45,220 |
| Immigrants | Syria | 85.2 /100 | #137 | Excellent $45,218 |
| Assyrians/Chaldeans/Syriacs | 84.8 /100 | #138 | Excellent $45,195 |
| Basques | 83.2 /100 | #139 | Excellent $45,086 |
| Immigrants | Jordan | 82.9 /100 | #140 | Excellent $45,066 |
| Slavs | 82.6 /100 | #141 | Excellent $45,049 |
| Ugandans | 82.6 /100 | #142 | Excellent $45,047 |
Demographics Similar to Apache by Per Capita Income
In terms of per capita income, the demographic groups most similar to Apache are Immigrants from Cuba ($34,910, a difference of 0.070%), Immigrants from Central America ($34,974, a difference of 0.25%), Kiowa ($35,102, a difference of 0.62%), Menominee ($34,578, a difference of 0.89%), and Mexican ($34,559, a difference of 0.95%).
| Demographics | Rating | Rank | Per Capita Income |
| Hispanics or Latinos | 0.0 /100 | #320 | Tragic $35,688 |
| Blacks/African Americans | 0.0 /100 | #321 | Tragic $35,564 |
| Creek | 0.0 /100 | #322 | Tragic $35,546 |
| Cheyenne | 0.0 /100 | #323 | Tragic $35,276 |
| Kiowa | 0.0 /100 | #324 | Tragic $35,102 |
| Immigrants | Central America | 0.0 /100 | #325 | Tragic $34,974 |
| Immigrants | Cuba | 0.0 /100 | #326 | Tragic $34,910 |
| Apache | 0.0 /100 | #327 | Tragic $34,886 |
| Menominee | 0.0 /100 | #328 | Tragic $34,578 |
| Mexicans | 0.0 /100 | #329 | Tragic $34,559 |
| Spanish American Indians | 0.0 /100 | #330 | Tragic $34,195 |
| Immigrants | Mexico | 0.0 /100 | #331 | Tragic $33,931 |
| Sioux | 0.0 /100 | #332 | Tragic $33,921 |
| Immigrants | Yemen | 0.0 /100 | #333 | Tragic $33,696 |
| Natives/Alaskans | 0.0 /100 | #334 | Tragic $33,279 |