Immigrants from Scotland vs Immigrants from El Salvador Single Mother Poverty
COMPARE
Immigrants from Scotland
Immigrants from El Salvador
Single Mother Poverty
Single Mother Poverty Comparison
Immigrants from Scotland
Immigrants from El Salvador
27.6%
SINGLE MOTHER POVERTY
98.9/ 100
METRIC RATING
81st/ 347
METRIC RANK
31.2%
SINGLE MOTHER POVERTY
0.3/ 100
METRIC RATING
261st/ 347
METRIC RANK
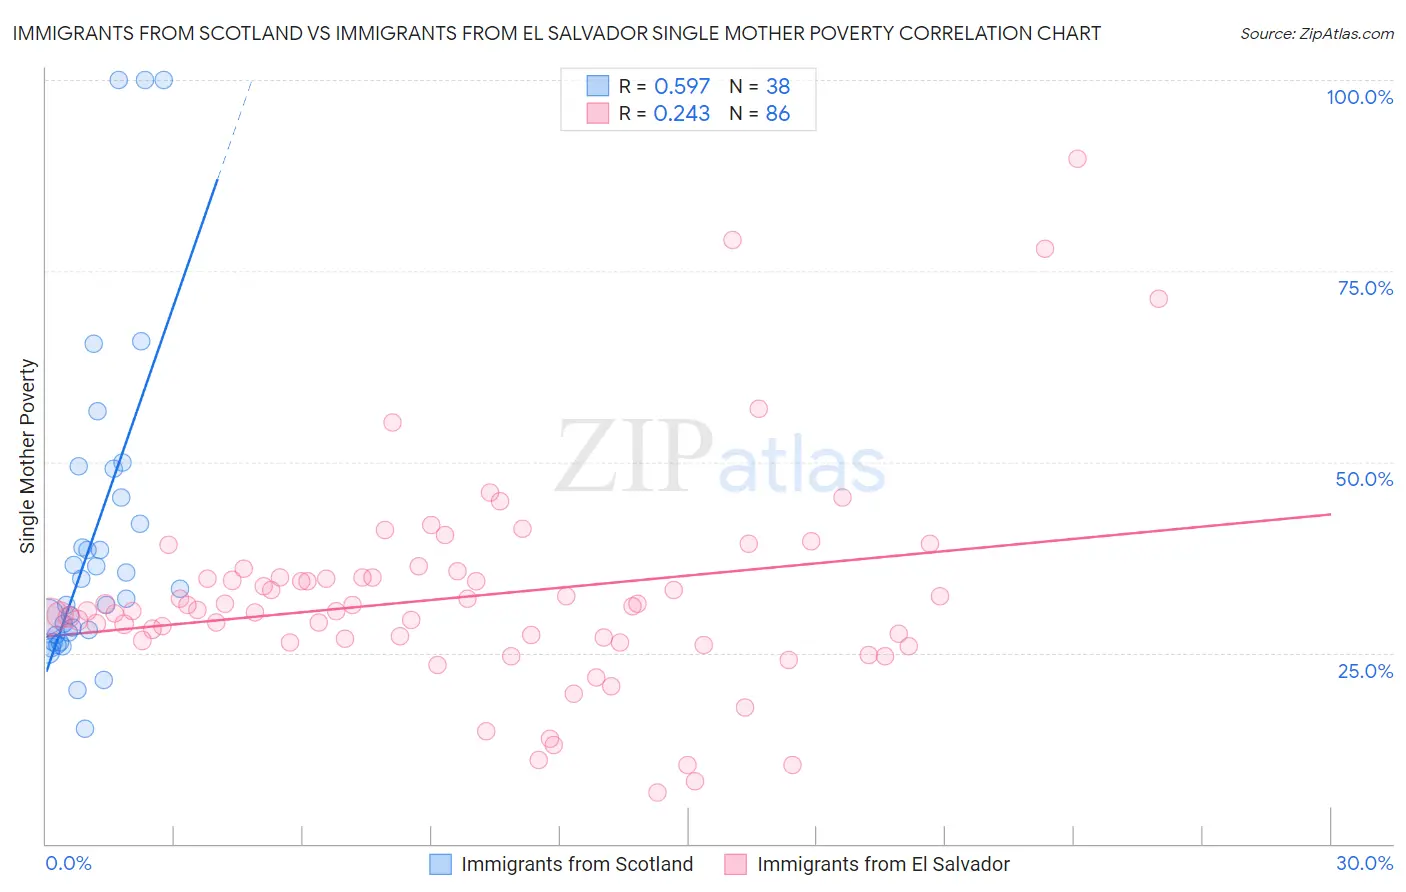
Immigrants from Scotland vs Immigrants from El Salvador Single Mother Poverty Correlation Chart
The statistical analysis conducted on geographies consisting of 192,448,213 people shows a substantial positive correlation between the proportion of Immigrants from Scotland and poverty level among single mothers in the United States with a correlation coefficient (R) of 0.597 and weighted average of 27.6%. Similarly, the statistical analysis conducted on geographies consisting of 352,610,814 people shows a weak positive correlation between the proportion of Immigrants from El Salvador and poverty level among single mothers in the United States with a correlation coefficient (R) of 0.243 and weighted average of 31.2%, a difference of 13.0%.
Single Mother Poverty Correlation Summary
| Measurement | Immigrants from Scotland | Immigrants from El Salvador |
| Minimum | 15.0% | 6.7% |
| Maximum | 100.0% | 89.6% |
| Range | 85.0% | 83.0% |
| Mean | 40.1% | 32.4% |
| Median | 32.7% | 30.6% |
| Interquartile 25% (IQ1) | 27.4% | 26.6% |
| Interquartile 75% (IQ3) | 45.3% | 34.8% |
| Interquartile Range (IQR) | 17.9% | 8.2% |
| Standard Deviation (Sample) | 21.1% | 13.9% |
| Standard Deviation (Population) | 20.8% | 13.8% |
Similar Demographics by Single Mother Poverty
Demographics Similar to Immigrants from Scotland by Single Mother Poverty
In terms of single mother poverty, the demographic groups most similar to Immigrants from Scotland are Immigrants from Cameroon (27.6%, a difference of 0.12%), Greek (27.7%, a difference of 0.18%), Immigrants from Latvia (27.7%, a difference of 0.21%), Mongolian (27.7%, a difference of 0.21%), and Immigrants from Ukraine (27.7%, a difference of 0.30%).
| Demographics | Rating | Rank | Single Mother Poverty |
| Immigrants | Europe | 99.3 /100 | #74 | Exceptional 27.4% |
| Immigrants | Sweden | 99.2 /100 | #75 | Exceptional 27.5% |
| Peruvians | 99.2 /100 | #76 | Exceptional 27.5% |
| Immigrants | Peru | 99.2 /100 | #77 | Exceptional 27.5% |
| Immigrants | North Macedonia | 99.2 /100 | #78 | Exceptional 27.5% |
| Immigrants | Italy | 99.1 /100 | #79 | Exceptional 27.5% |
| Taiwanese | 99.1 /100 | #80 | Exceptional 27.5% |
| Immigrants | Scotland | 98.9 /100 | #81 | Exceptional 27.6% |
| Immigrants | Cameroon | 98.8 /100 | #82 | Exceptional 27.6% |
| Greeks | 98.7 /100 | #83 | Exceptional 27.7% |
| Immigrants | Latvia | 98.7 /100 | #84 | Exceptional 27.7% |
| Mongolians | 98.7 /100 | #85 | Exceptional 27.7% |
| Immigrants | Ukraine | 98.6 /100 | #86 | Exceptional 27.7% |
| Afghans | 98.5 /100 | #87 | Exceptional 27.7% |
| Ethiopians | 98.4 /100 | #88 | Exceptional 27.7% |
Demographics Similar to Immigrants from El Salvador by Single Mother Poverty
In terms of single mother poverty, the demographic groups most similar to Immigrants from El Salvador are White/Caucasian (31.2%, a difference of 0.080%), Hmong (31.2%, a difference of 0.14%), Immigrants from Bangladesh (31.1%, a difference of 0.23%), Immigrants from Caribbean (31.1%, a difference of 0.27%), and Immigrants from Bahamas (31.1%, a difference of 0.35%).
| Demographics | Rating | Rank | Single Mother Poverty |
| Senegalese | 0.5 /100 | #254 | Tragic 31.0% |
| Belizeans | 0.5 /100 | #255 | Tragic 31.0% |
| Immigrants | West Indies | 0.4 /100 | #256 | Tragic 31.1% |
| Immigrants | Bahamas | 0.4 /100 | #257 | Tragic 31.1% |
| Immigrants | Caribbean | 0.4 /100 | #258 | Tragic 31.1% |
| Immigrants | Bangladesh | 0.4 /100 | #259 | Tragic 31.1% |
| Whites/Caucasians | 0.3 /100 | #260 | Tragic 31.2% |
| Immigrants | El Salvador | 0.3 /100 | #261 | Tragic 31.2% |
| Hmong | 0.3 /100 | #262 | Tragic 31.2% |
| Bahamians | 0.2 /100 | #263 | Tragic 31.3% |
| Immigrants | Ecuador | 0.2 /100 | #264 | Tragic 31.3% |
| German Russians | 0.2 /100 | #265 | Tragic 31.3% |
| Sub-Saharan Africans | 0.2 /100 | #266 | Tragic 31.4% |
| Immigrants | Belize | 0.2 /100 | #267 | Tragic 31.4% |
| Immigrants | Senegal | 0.1 /100 | #268 | Tragic 31.5% |