Lebanese vs Immigrants from Bulgaria Single Mother Poverty
COMPARE
Lebanese
Immigrants from Bulgaria
Single Mother Poverty
Single Mother Poverty Comparison
Lebanese
Immigrants from Bulgaria
29.4%
SINGLE MOTHER POVERTY
32.5/ 100
METRIC RATING
187th/ 347
METRIC RANK
27.1%
SINGLE MOTHER POVERTY
99.7/ 100
METRIC RATING
54th/ 347
METRIC RANK
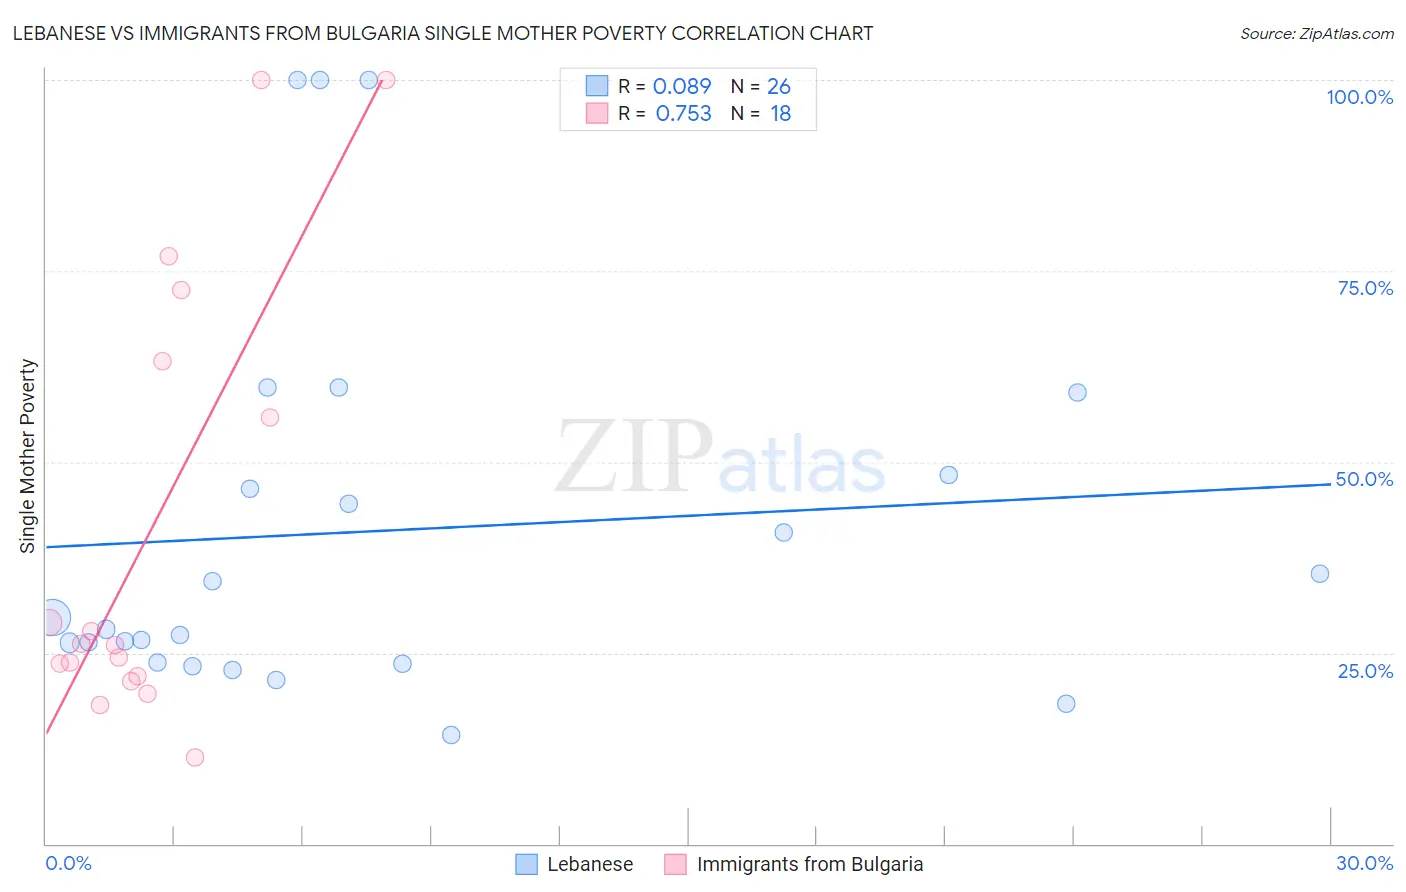
Lebanese vs Immigrants from Bulgaria Single Mother Poverty Correlation Chart
The statistical analysis conducted on geographies consisting of 390,539,511 people shows a slight positive correlation between the proportion of Lebanese and poverty level among single mothers in the United States with a correlation coefficient (R) of 0.089 and weighted average of 29.4%. Similarly, the statistical analysis conducted on geographies consisting of 170,164,064 people shows a strong positive correlation between the proportion of Immigrants from Bulgaria and poverty level among single mothers in the United States with a correlation coefficient (R) of 0.753 and weighted average of 27.1%, a difference of 8.4%.
Single Mother Poverty Correlation Summary
| Measurement | Lebanese | Immigrants from Bulgaria |
| Minimum | 14.3% | 11.3% |
| Maximum | 100.0% | 100.0% |
| Range | 85.7% | 88.7% |
| Mean | 41.0% | 41.2% |
| Median | 28.9% | 26.1% |
| Interquartile 25% (IQ1) | 23.8% | 22.0% |
| Interquartile 75% (IQ3) | 48.2% | 63.2% |
| Interquartile Range (IQR) | 24.4% | 41.2% |
| Standard Deviation (Sample) | 25.2% | 28.9% |
| Standard Deviation (Population) | 24.7% | 28.1% |
Similar Demographics by Single Mother Poverty
Demographics Similar to Lebanese by Single Mother Poverty
In terms of single mother poverty, the demographic groups most similar to Lebanese are Guamanian/Chamorro (29.4%, a difference of 0.040%), Immigrants from Africa (29.4%, a difference of 0.050%), Immigrants from Germany (29.5%, a difference of 0.11%), Immigrants from Trinidad and Tobago (29.5%, a difference of 0.18%), and Yugoslavian (29.4%, a difference of 0.19%).
| Demographics | Rating | Rank | Single Mother Poverty |
| Immigrants | Norway | 41.5 /100 | #180 | Average 29.3% |
| Canadians | 40.4 /100 | #181 | Average 29.3% |
| Immigrants | Eastern Africa | 38.5 /100 | #182 | Fair 29.3% |
| Nepalese | 38.3 /100 | #183 | Fair 29.3% |
| Nigerians | 38.0 /100 | #184 | Fair 29.3% |
| Ghanaians | 36.8 /100 | #185 | Fair 29.4% |
| Yugoslavians | 36.0 /100 | #186 | Fair 29.4% |
| Lebanese | 32.5 /100 | #187 | Fair 29.4% |
| Guamanians/Chamorros | 31.8 /100 | #188 | Fair 29.4% |
| Immigrants | Africa | 31.6 /100 | #189 | Fair 29.4% |
| Immigrants | Germany | 30.4 /100 | #190 | Fair 29.5% |
| Immigrants | Trinidad and Tobago | 29.2 /100 | #191 | Fair 29.5% |
| Moroccans | 28.6 /100 | #192 | Fair 29.5% |
| Basques | 28.3 /100 | #193 | Fair 29.5% |
| Icelanders | 26.1 /100 | #194 | Fair 29.5% |
Demographics Similar to Immigrants from Bulgaria by Single Mother Poverty
In terms of single mother poverty, the demographic groups most similar to Immigrants from Bulgaria are Immigrants from Jordan (27.1%, a difference of 0.030%), Immigrants from Egypt (27.1%, a difference of 0.030%), Immigrants from South Eastern Asia (27.1%, a difference of 0.070%), Immigrants from Romania (27.2%, a difference of 0.080%), and Immigrants from Argentina (27.1%, a difference of 0.11%).
| Demographics | Rating | Rank | Single Mother Poverty |
| Egyptians | 99.8 /100 | #47 | Exceptional 26.9% |
| Immigrants | Poland | 99.8 /100 | #48 | Exceptional 26.9% |
| Cambodians | 99.8 /100 | #49 | Exceptional 27.0% |
| Laotians | 99.8 /100 | #50 | Exceptional 27.0% |
| Immigrants | Argentina | 99.7 /100 | #51 | Exceptional 27.1% |
| Immigrants | South Eastern Asia | 99.7 /100 | #52 | Exceptional 27.1% |
| Immigrants | Jordan | 99.7 /100 | #53 | Exceptional 27.1% |
| Immigrants | Bulgaria | 99.7 /100 | #54 | Exceptional 27.1% |
| Immigrants | Egypt | 99.7 /100 | #55 | Exceptional 27.1% |
| Immigrants | Romania | 99.7 /100 | #56 | Exceptional 27.2% |
| Palestinians | 99.7 /100 | #57 | Exceptional 27.2% |
| Argentineans | 99.6 /100 | #58 | Exceptional 27.2% |
| Paraguayans | 99.6 /100 | #59 | Exceptional 27.2% |
| Eastern Europeans | 99.6 /100 | #60 | Exceptional 27.2% |
| Immigrants | Eastern Europe | 99.6 /100 | #61 | Exceptional 27.2% |