Houma vs Immigrants from Afghanistan Median Female Earnings
COMPARE
Houma
Immigrants from Afghanistan
Median Female Earnings
Median Female Earnings Comparison
Houma
Immigrants from Afghanistan
$30,343
MEDIAN FEMALE EARNINGS
0.0/ 100
METRIC RATING
347th/ 347
METRIC RANK
$42,055
MEDIAN FEMALE EARNINGS
99.3/ 100
METRIC RATING
89th/ 347
METRIC RANK
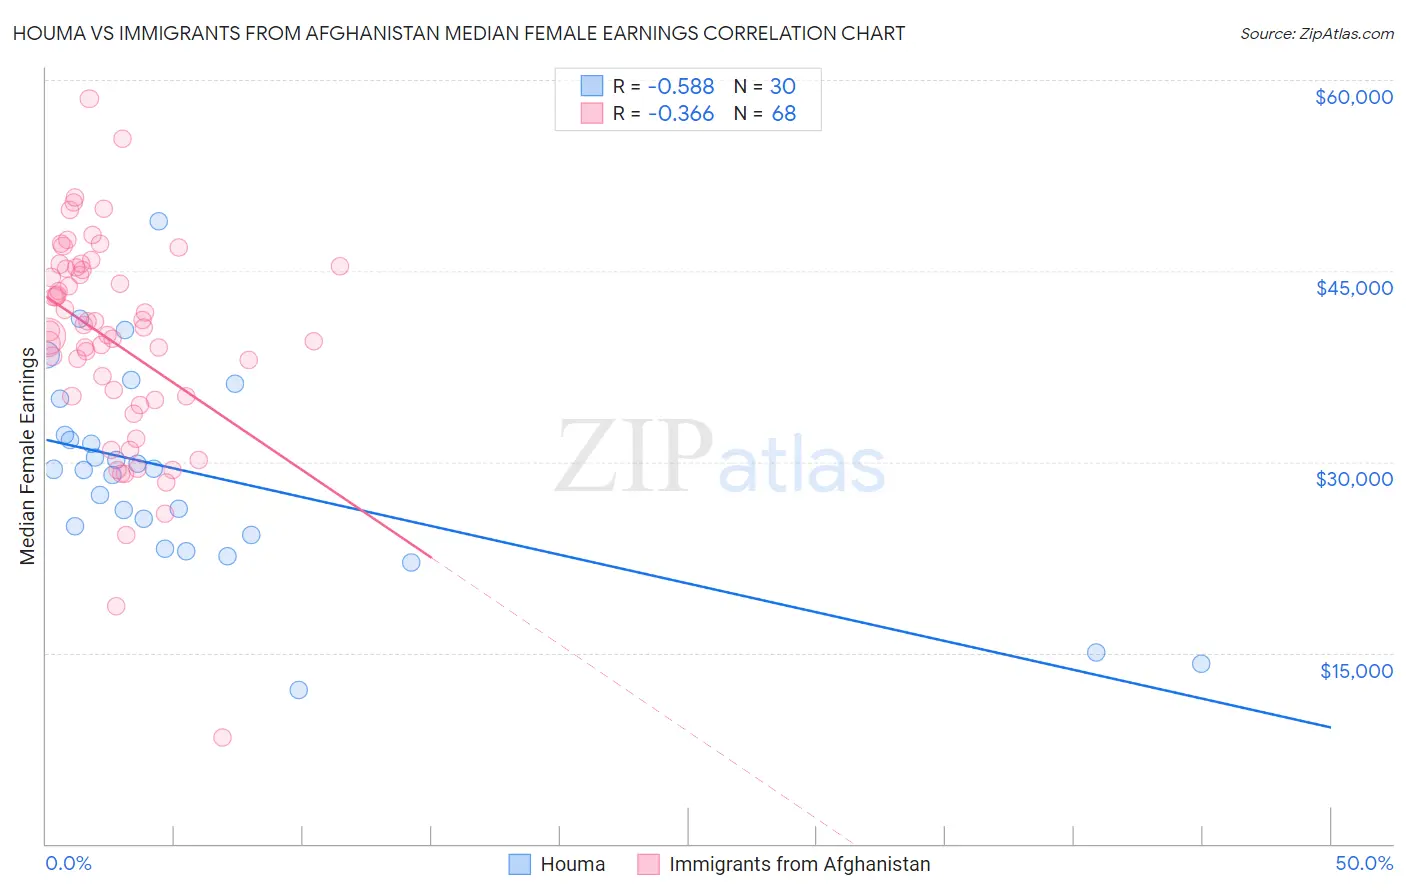
Houma vs Immigrants from Afghanistan Median Female Earnings Correlation Chart
The statistical analysis conducted on geographies consisting of 36,795,297 people shows a substantial negative correlation between the proportion of Houma and median female earnings in the United States with a correlation coefficient (R) of -0.588 and weighted average of $30,343. Similarly, the statistical analysis conducted on geographies consisting of 147,640,622 people shows a mild negative correlation between the proportion of Immigrants from Afghanistan and median female earnings in the United States with a correlation coefficient (R) of -0.366 and weighted average of $42,055, a difference of 38.6%.
Median Female Earnings Correlation Summary
| Measurement | Houma | Immigrants from Afghanistan |
| Minimum | $12,038 | $8,380 |
| Maximum | $48,900 | $58,562 |
| Range | $36,862 | $50,182 |
| Mean | $28,868 | $39,466 |
| Median | $29,403 | $40,414 |
| Interquartile 25% (IQ1) | $24,292 | $34,989 |
| Interquartile 75% (IQ3) | $32,114 | $45,239 |
| Interquartile Range (IQR) | $7,822 | $10,250 |
| Standard Deviation (Sample) | $8,016 | $8,425 |
| Standard Deviation (Population) | $7,881 | $8,363 |
Similar Demographics by Median Female Earnings
Demographics Similar to Houma by Median Female Earnings
In terms of median female earnings, the demographic groups most similar to Houma are Arapaho ($31,489, a difference of 3.8%), Puerto Rican ($31,560, a difference of 4.0%), Lumbee ($32,500, a difference of 7.1%), Pueblo ($32,564, a difference of 7.3%), and Yup'ik ($32,730, a difference of 7.9%).
| Demographics | Rating | Rank | Median Female Earnings |
| Mexicans | 0.0 /100 | #333 | Tragic $33,664 |
| Spanish American Indians | 0.0 /100 | #334 | Tragic $33,625 |
| Creek | 0.0 /100 | #335 | Tragic $33,437 |
| Ottawa | 0.0 /100 | #336 | Tragic $33,378 |
| Yakama | 0.0 /100 | #337 | Tragic $33,354 |
| Immigrants | Cuba | 0.0 /100 | #338 | Tragic $33,291 |
| Immigrants | Mexico | 0.0 /100 | #339 | Tragic $33,236 |
| Tohono O'odham | 0.0 /100 | #340 | Tragic $33,205 |
| Navajo | 0.0 /100 | #341 | Tragic $33,046 |
| Yup'ik | 0.0 /100 | #342 | Tragic $32,730 |
| Pueblo | 0.0 /100 | #343 | Tragic $32,564 |
| Lumbee | 0.0 /100 | #344 | Tragic $32,500 |
| Puerto Ricans | 0.0 /100 | #345 | Tragic $31,560 |
| Arapaho | 0.0 /100 | #346 | Tragic $31,489 |
| Houma | 0.0 /100 | #347 | Tragic $30,343 |
Demographics Similar to Immigrants from Afghanistan by Median Female Earnings
In terms of median female earnings, the demographic groups most similar to Immigrants from Afghanistan are Immigrants from Northern Africa ($42,084, a difference of 0.070%), Ukrainian ($42,015, a difference of 0.10%), Lithuanian ($42,108, a difference of 0.12%), Immigrants from St. Vincent and the Grenadines ($42,108, a difference of 0.13%), and Immigrants from Western Europe ($41,990, a difference of 0.15%).
| Demographics | Rating | Rank | Median Female Earnings |
| Immigrants | Morocco | 99.5 /100 | #82 | Exceptional $42,229 |
| Immigrants | Sierra Leone | 99.5 /100 | #83 | Exceptional $42,214 |
| Armenians | 99.5 /100 | #84 | Exceptional $42,212 |
| Laotians | 99.4 /100 | #85 | Exceptional $42,133 |
| Immigrants | St. Vincent and the Grenadines | 99.3 /100 | #86 | Exceptional $42,108 |
| Lithuanians | 99.3 /100 | #87 | Exceptional $42,108 |
| Immigrants | Northern Africa | 99.3 /100 | #88 | Exceptional $42,084 |
| Immigrants | Afghanistan | 99.3 /100 | #89 | Exceptional $42,055 |
| Ukrainians | 99.2 /100 | #90 | Exceptional $42,015 |
| Immigrants | Western Europe | 99.2 /100 | #91 | Exceptional $41,990 |
| Argentineans | 99.1 /100 | #92 | Exceptional $41,952 |
| Immigrants | Grenada | 99.0 /100 | #93 | Exceptional $41,932 |
| Moroccans | 98.9 /100 | #94 | Exceptional $41,872 |
| Immigrants | Netherlands | 98.9 /100 | #95 | Exceptional $41,870 |
| South Africans | 98.8 /100 | #96 | Exceptional $41,825 |