Guyanese vs Basque Married-Couple Family Poverty
COMPARE
Guyanese
Basque
Married-Couple Family Poverty
Married-Couple Family Poverty Comparison
Guyanese
Basques
6.5%
MARRIED-COUPLE FAMILY POVERTY
0.0/ 100
METRIC RATING
286th/ 347
METRIC RANK
4.6%
MARRIED-COUPLE FAMILY POVERTY
98.5/ 100
METRIC RATING
91st/ 347
METRIC RANK
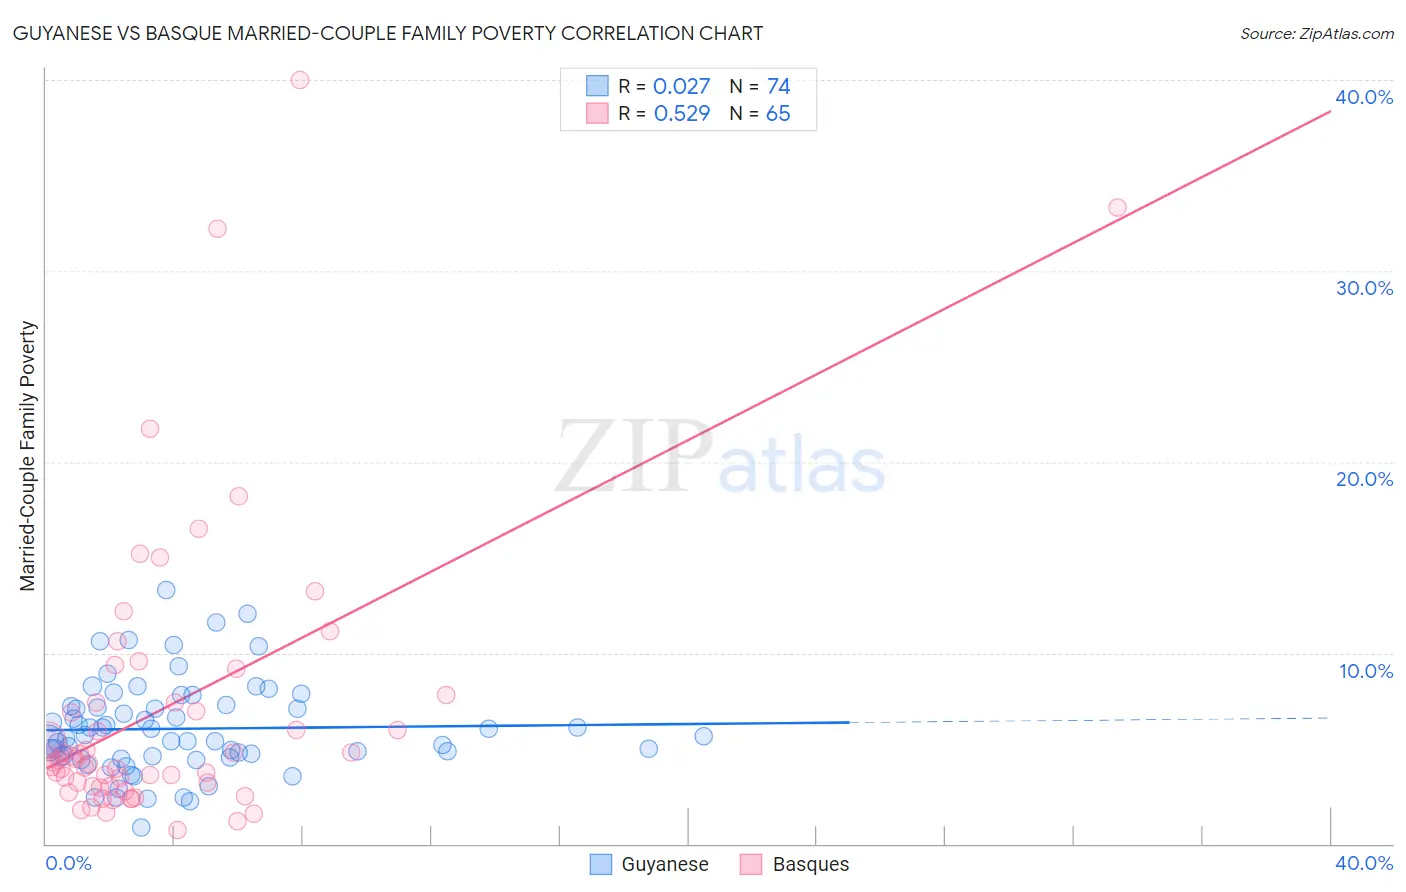
Guyanese vs Basque Married-Couple Family Poverty Correlation Chart
The statistical analysis conducted on geographies consisting of 175,831,984 people shows no correlation between the proportion of Guyanese and poverty level among married-couple families in the United States with a correlation coefficient (R) of 0.027 and weighted average of 6.5%. Similarly, the statistical analysis conducted on geographies consisting of 165,263,383 people shows a substantial positive correlation between the proportion of Basques and poverty level among married-couple families in the United States with a correlation coefficient (R) of 0.529 and weighted average of 4.6%, a difference of 41.3%.
Married-Couple Family Poverty Correlation Summary
| Measurement | Guyanese | Basque |
| Minimum | 0.88% | 0.72% |
| Maximum | 13.3% | 40.0% |
| Range | 12.4% | 39.3% |
| Mean | 6.0% | 7.1% |
| Median | 5.6% | 4.4% |
| Interquartile 25% (IQ1) | 4.6% | 3.0% |
| Interquartile 75% (IQ3) | 7.2% | 7.6% |
| Interquartile Range (IQR) | 2.6% | 4.6% |
| Standard Deviation (Sample) | 2.4% | 7.6% |
| Standard Deviation (Population) | 2.4% | 7.6% |
Similar Demographics by Married-Couple Family Poverty
Demographics Similar to Guyanese by Married-Couple Family Poverty
In terms of married-couple family poverty, the demographic groups most similar to Guyanese are Black/African American (6.5%, a difference of 0.10%), Ecuadorian (6.5%, a difference of 0.37%), Salvadoran (6.5%, a difference of 0.56%), Dutch West Indian (6.4%, a difference of 0.61%), and Ute (6.4%, a difference of 0.73%).
| Demographics | Rating | Rank | Married-Couple Family Poverty |
| Houma | 0.0 /100 | #279 | Tragic 6.4% |
| West Indians | 0.0 /100 | #280 | Tragic 6.4% |
| Mexican American Indians | 0.0 /100 | #281 | Tragic 6.4% |
| Seminole | 0.0 /100 | #282 | Tragic 6.4% |
| Ute | 0.0 /100 | #283 | Tragic 6.4% |
| Dutch West Indians | 0.0 /100 | #284 | Tragic 6.4% |
| Blacks/African Americans | 0.0 /100 | #285 | Tragic 6.5% |
| Guyanese | 0.0 /100 | #286 | Tragic 6.5% |
| Ecuadorians | 0.0 /100 | #287 | Tragic 6.5% |
| Salvadorans | 0.0 /100 | #288 | Tragic 6.5% |
| Nepalese | 0.0 /100 | #289 | Tragic 6.5% |
| Immigrants | Barbados | 0.0 /100 | #290 | Tragic 6.5% |
| Belizeans | 0.0 /100 | #291 | Tragic 6.5% |
| Immigrants | Lebanon | 0.0 /100 | #292 | Tragic 6.6% |
| Arapaho | 0.0 /100 | #293 | Tragic 6.6% |
Demographics Similar to Basques by Married-Couple Family Poverty
In terms of married-couple family poverty, the demographic groups most similar to Basques are Immigrants from Switzerland (4.6%, a difference of 0.040%), Immigrants from Norway (4.6%, a difference of 0.080%), Immigrants from Czechoslovakia (4.6%, a difference of 0.11%), Bolivian (4.6%, a difference of 0.22%), and Korean (4.6%, a difference of 0.26%).
| Demographics | Rating | Rank | Married-Couple Family Poverty |
| Immigrants | Croatia | 98.7 /100 | #84 | Exceptional 4.6% |
| South Africans | 98.7 /100 | #85 | Exceptional 4.6% |
| Immigrants | Turkey | 98.6 /100 | #86 | Exceptional 4.6% |
| Immigrants | North Macedonia | 98.6 /100 | #87 | Exceptional 4.6% |
| Bolivians | 98.6 /100 | #88 | Exceptional 4.6% |
| Immigrants | Czechoslovakia | 98.5 /100 | #89 | Exceptional 4.6% |
| Immigrants | Switzerland | 98.5 /100 | #90 | Exceptional 4.6% |
| Basques | 98.5 /100 | #91 | Exceptional 4.6% |
| Immigrants | Norway | 98.4 /100 | #92 | Exceptional 4.6% |
| Koreans | 98.3 /100 | #93 | Exceptional 4.6% |
| Immigrants | Italy | 98.3 /100 | #94 | Exceptional 4.6% |
| Portuguese | 98.3 /100 | #95 | Exceptional 4.6% |
| Immigrants | Poland | 98.3 /100 | #96 | Exceptional 4.6% |
| Immigrants | Belgium | 98.2 /100 | #97 | Exceptional 4.6% |
| Native Hawaiians | 98.0 /100 | #98 | Exceptional 4.6% |